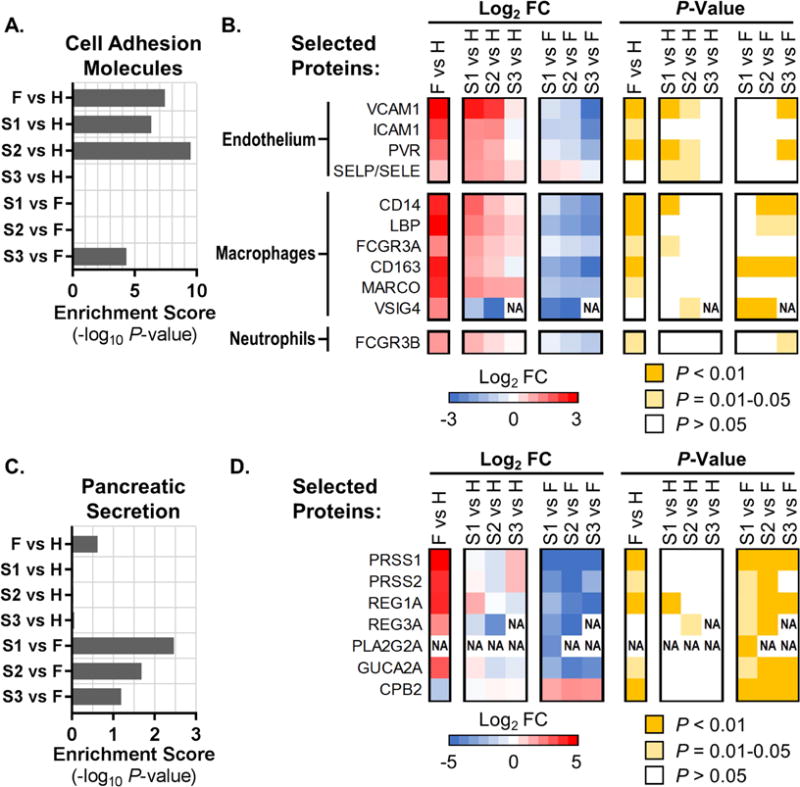
Figure 4. EVD signatures in the plasma proteome.

Pathway enrichments and heat maps showing average pathway protein expression levels (log2 fold change, FC) and associated P-values for ‘Cell Adhesion Molecules’ (KEGG pathway hsa04514; panels (A) and (B)), and ‘Pancreatic Secretion’ (KEGG pathway hsa04972; panels (C) and (D)). (A and C) KEGG pathway enrichment scores as the negative log10 of the enrichment P-value for EVD patients (fatalities, ‘F’; survivors’ first, second, and third samples, ‘S1’, ‘S2’, and ‘S3’) compared with healthy controls (H); or for S1/S2/S3 vs. F comparisons. (B and D) Expression levels and associated P-values for a selected set of plasma proteins (indicated by Entrez Gene Official Symbols) included in the respective KEGG pathways (data are represented in the same way as in Fig. 2B). ‘NA’ in heat maps indicates that FC and P-values were not calculated due to an insufficient number of values in one of the conditions. In panel (B), ‘SELP/SELE’ indicates a protein profile that cannot be assigned to one of these proteins due to their high homology. See also Table S2 and Table S3.
