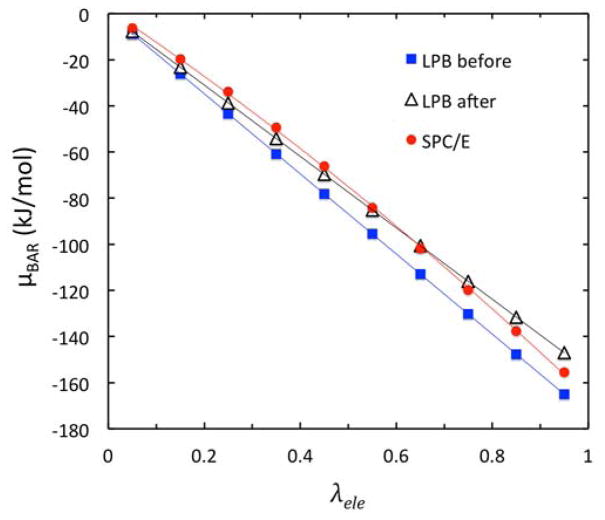
Figure 3.
Optimization of the ionic radii via detailed analysis of electrostatic excess chemical potential μBAR versus λele for the lowest molality at 0.10 mol/kg. The benchmark data from the SPC/E BAR calculation are shown as red dots. LPB before and LPB after the optimization are shown as blue squares and open triangles, respectively. The ion-solvent surface is defined as classical solvent excluded surface using given ionic radii starting from the default Amber radii (before) or using those scaled to minimize the RMSD with respect to the SPC/E BAR values (after).

