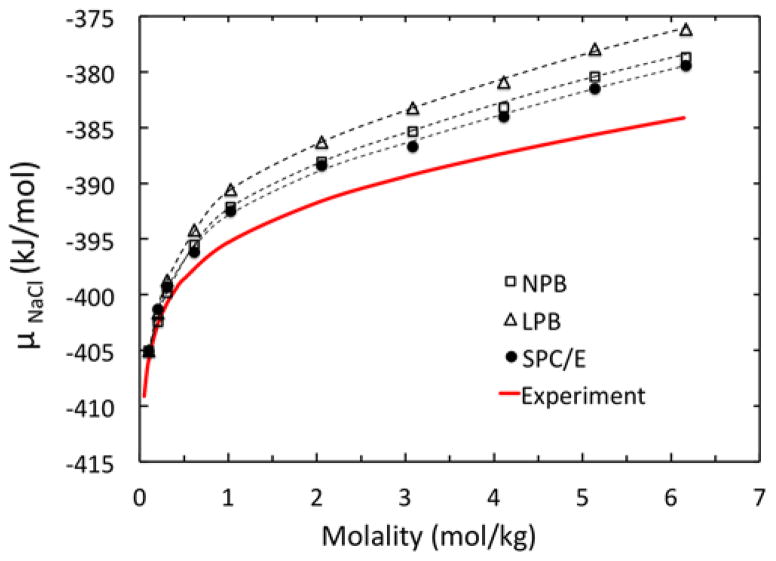
Figure 5.
Chemical potential μNaCl calculated with LPB, NPB, and SPC/E models, respectively, versus experimental data for molality in the range of of 0.10 to 6.17 mol/kg. Trend lines are second-order polynomials best-fitted to the data. See Table 2 for detailed data breakdown.

