
Figure 3.
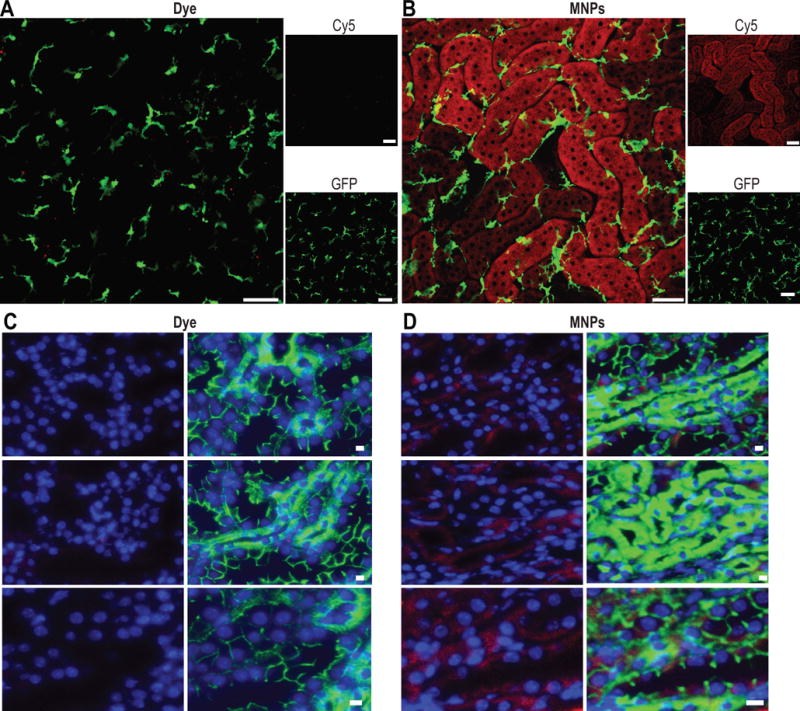
Renal tissue imaging. Intravital microscopy of mice injected IV with A) fluorescent dye (equal to amount found in particles) or B) 25 mg/kg MNPs. Animals were imaged at 72 hours following injection. Red denotes dye fluorescence (free or in nanoparticles; imaged using Cy5 filter); green denotes GFP-expressing renal macrophages. Scale bars are 50 μm for panels A and B. C) Immunofluorescence imaging of fixed tissues from perfused mice injected with C) dye alone (equal to amount found in particles) or D) 25 mg/kg MNPs. Red denotes dye fluorescence (free or in nanoparticles); green denotes E-cadherin staining (strong staining for proximal tubular epithelial cells, weak staining for distal tubular epithelial cells); blue denotes DAPI nuclear stain. Scale bars are 10 μm for panels C and D.