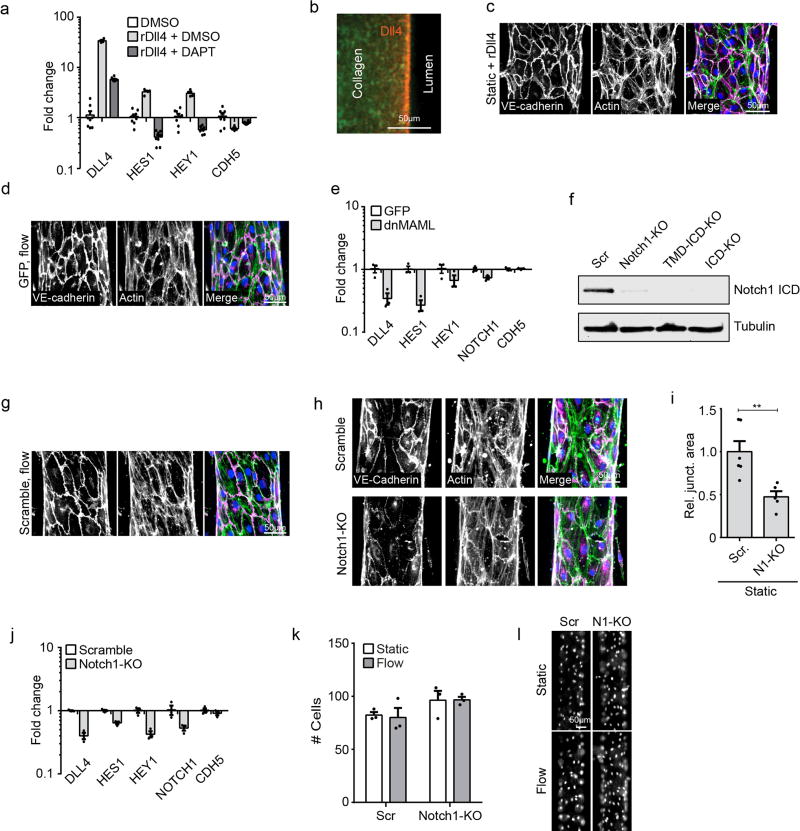
Extended Data Figure 3. Non-transcriptional Notch1 signaling regulates vascular barrier function.
a, Gene expression of Notch1 target genes HES1 and HEY1, the Notch1 ligand DLL4, and VE-cadherin (CDH5) measured via qPCR in ECs treated with DAPT or DMSO load control on Dll4-coated and control tissue culture plastic substrates. b, Fluorescent micrograph of rDll4-coated device prior to cell seeding (green – Alexa Fluor 488 Collagen I, red – immunostain of Dll4). c, Fluorescent micrograph of ECs in hEMVs coated with rDll4 prior to cell seeding. d, Micrographs of GFP-infection control cells under flow. e, Gene expression of HES1, HEY1, DLL4, NOTCH1, and VE-cadherin (CDH5) measured via qPCR in ECs expressing dnMAML or infection control (GFP). f, Western blot validation of Notch1 CRISPR lines: Scramble, Notch1-KO, TMD+ICD-KO, and ICD-KO. g, Fluorescent micrographs of CRISPR/Cas9 scramble control cells under flow. h, Fluorescent micrographs of Scramble and Notch1-KO hEMVs under static conditions immunostained for VE-cadherin and labeled with phalloidin (actin). i, Quantification of junctional area measured from VE-cadherin immunostained micrographs. j, Gene expression measured via qPCR in Notch1-KO cells and scramble control cells. k, Quantification of cell number in f.o.v at 10x magnification of Scramble or Notch1-KO hEMV under static and flow conditions. l, Micrographs of nuclei as visualized by DAPI in Scramble or Notch1-KO hEMVs. For all plots, mean ± s.e.m., n≥3 hEMVs, **p<0.01. Exact p and n values available in Figure Source Data, images representative of at least three independent experiments.

