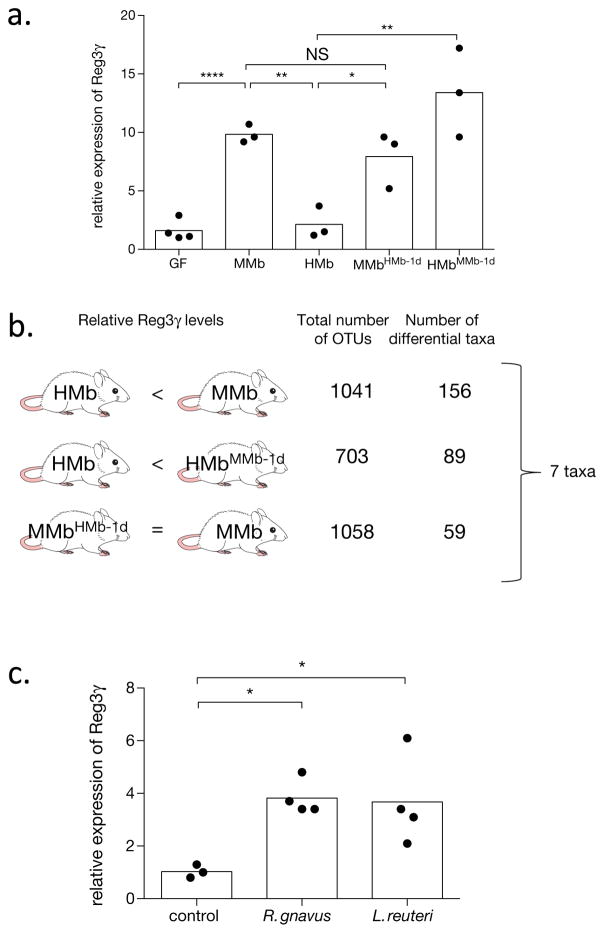
Figure 4. Ruminococcus gnavus and Lactobacillus reuteri induce intestinal expression of Reg3γ.
a. qPCR analysis of ileal Reg3γ expression in mice with varying microbiotas (n=4 mice for GF, n=3 mice for all other groups). Reg3γ expression is normalized to GF mice. b. The different pairwise comparisons used for triangulation, with 4 mice included per group; the total number of operational taxonomic units (OTUs) in each pair; and the number of differentially abundant taxa. The 7 taxa identified in this analysis are detailed in Extended Data Table S1. c. qPCR analysis of ileal Reg3γ expression in HMb mice after oral administration of control bacteria (n=3 mice), R. gnavus (n=4 mice), or L. reuteri (n=4 mice). Reg3γ expression is normalized to HMb mice + control. Individual (dots) and mean (bars) values are shown in panels a and c. NS, not significant; *, p<0.05; **, p<0.01; ****, p<0.0001 by two-tailed t test (a, c).

