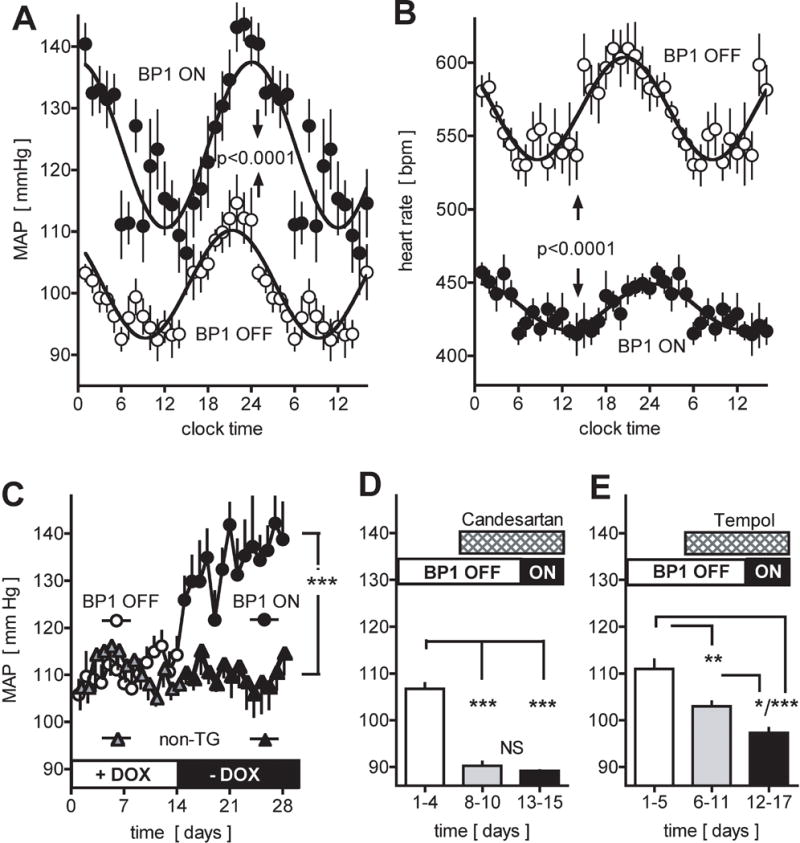
Figure 2.

Effect of conditional expression of the BP1 transgene and of inhibitors on mean arterial pressure (MAP) and heart rate (HR). A, B, Circadian changes in MAP (A) and HR (B) by telemetry of conscious mice. Averages for 10 days before (BP1 OFF, open symbols) and 10 days after the induction of the BP1 transgene (BP1 ON, closed symbols) relative to the 24 hour clock time. Dark and light periods are indicated. Mean ± SEM values (for n=10 time points) from one representative animal (total n=6). P<0.0001 by non-linear regression analysis and ANOVA. C, Effect of induction of BP1 transgene expression on night time MAP. Gene expression was induced by switching from a tetracycline containing to a regular chow (+DOX to −DOX; open and filled circles). Non-transgenic littermates (non-TG; triangles) were subjected to the same diet schedule. Mean ± SEM of night time MAP; n = 6 per group. ANOVA analysis of BP1 ON versus OFF or versus control group. ***, P<0.0001. D, E, Effect of treatment with candesartan (D) or tempol (E) on night time MAP of animals with the BP1 transgene OFF or ON. Mean ± SEM; n = 5 per group. *, P<0.05; **, P<0.01; ***, P <0.0001 by ANOVA.
