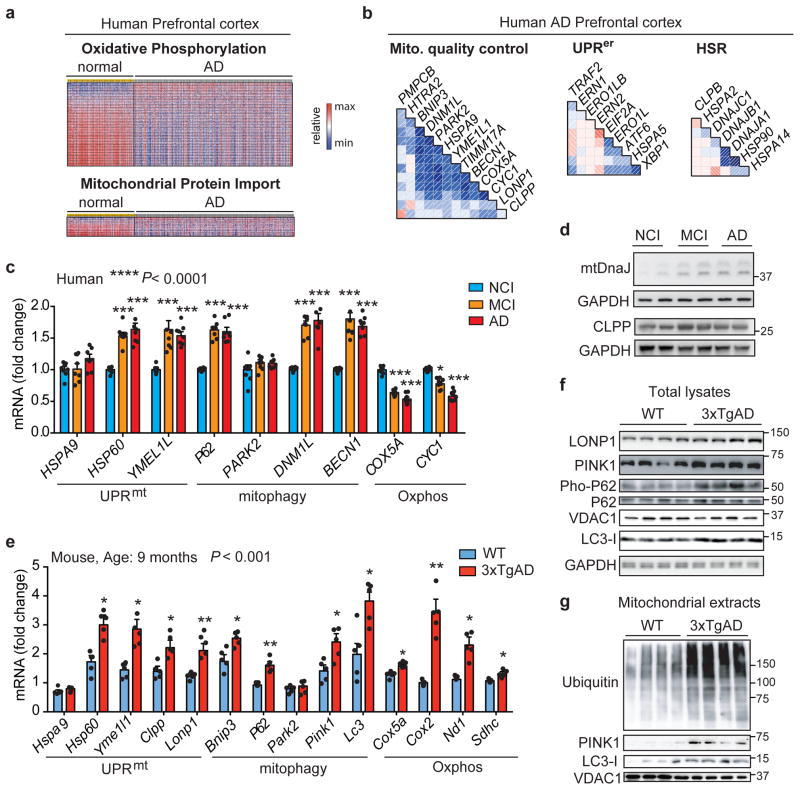
Figure 1. Mitochondrial dysfunction in AD is typified by a conserved Mitochondrial Stress Response.
a Heatmap of the expression levels of Oxphos and mitochondrial import genes in human AD prefrontal cortex (GN328; normal, n=195; AD, n=388 individuals). b, Correlation plots of mitochondrial stress genes, UPRer and HSR levels in prefrontal cortex from AD patients (GN328; n as in a). See Extended Data Fig. 1 and Supplementary Table 1–5. c–d, Transcript analysis of the Mitochondrial Stress Response signature (c; MSR, n=8 per group) and Western blot (d, WB, n=2 individuals) of mtDNaJ and CLPP in brains of humans with no cognitive impairment (NCI), mild-cognitive impairment (MCI) and mild/moderate AD. e–f, Transcript (e) and immunoblot (f) analysis of MSR genes in cortex of 9-months old wild type (WT) and 3xTgAD mice (WT, n=5; 3xTgAD, n=5 for RNA; WT, n=4; 3xTgAD, n=4 for WB, representative of 6 animals). g, Immunoblot (WT, n=4; 3xTgAD, n=4, WB representative of 5 animals) of mitophagy and autophagy proteins in mitochondrial extracts from cortex tissues of the animals in e–f. Values in the figure are mean ± s.e.m. *P<0.05; **P≤0.01; ***P≤0.001. Throughout the figure, overall differences between conditions were assessed by two-way ANOVA. Differences for individual genes/proteins were assessed using two-tailed t tests (95% confidence interval). All experiments were performed independently twice. Mito., mitochondrial. See also Extended Data Fig. 2. For uncropped gel source data, see Supplementary Fig. 1. For all the individual p values, see the Fig. 1 Spreadsheet file.

