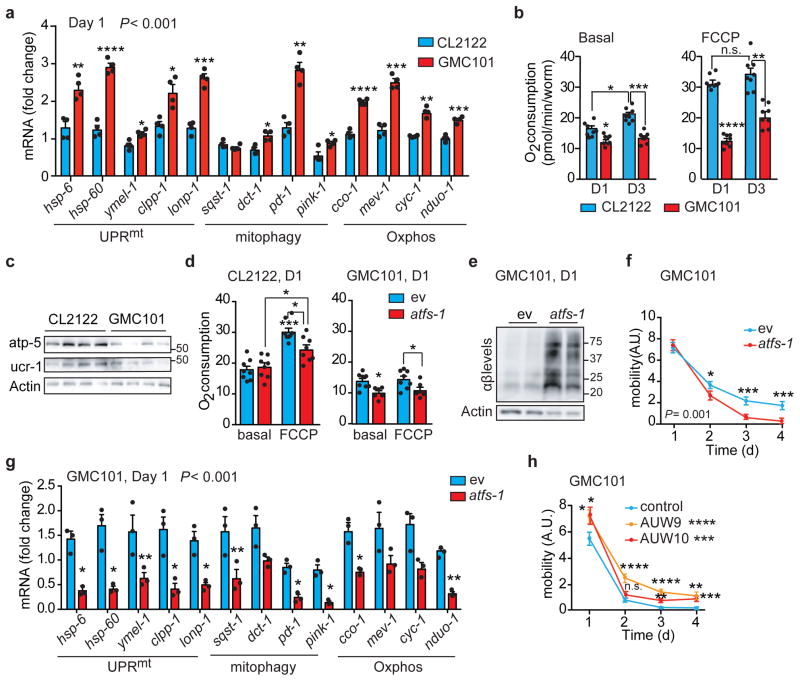
Figure 2. Mitochondrial dysfunction and reliance on atfs-1 of GMC101 worms upon proteotoxic stress.
a, MSR transcript analysis in CL2122 and GMC101 (n=3 biologically independent samples). b, Basal respiration and after FCCP (45 min, 10μM) of day 1 (D1) and 3 (D3) adult worms (CL2122, n=8; GMC101, n=8 biologically independent samples). c, Immunoblot (CL2122, n=4; GMC101, n=4, WB representative of 5 biological replicates) of Oxphos proteins in control and GMC101 at D1. d, Respiration assay as in b in CL2122 (ev, n=8; atfs-1, n=8 biologically independent samples) and GMC101 (ev, n=8; atfs-1, n=6 biologically independent samples) fed with atfs-1 RNAi. e, Amyloid aggregation in GMC101 upon atfs-1 RNAi shown by WB of 2 biological repeats. f, Mobility of GMC101 fed with 50% atfs-1 RNAi (ev, n=59; atfs-11/2, n=50 worms). g, MSR transcript analysis of GMC101 upon atfs-1 RNAi (n=3 biologically independent samples). h, Mobility of control and afts-1 overexpressing GMC101 strains (GMC101, n=61; AUW9, n=48; AUW10, n=41 worms). Values in the figure are mean ± s.e.m. *P<0.05; **P≤0.01; ***P≤0.001; ****P≤0.0001; n.s., non-significant. Throughout the figure, overall differences between conditions were assessed by two-way ANOVA. Differences for individual genes/proteins were assessed using two-tailed t tests (95% confidence interval). All experiments were performed at least independently twice. Mito., mitochondrial; ev, scrambled RNAi; A.U., arbitrary units. See also Extended Data Fig. 3–4. For uncropped gel source data, see Supplementary Fig. 1. For all the individual p values, see the Fig. 2 Spreadsheet file.

