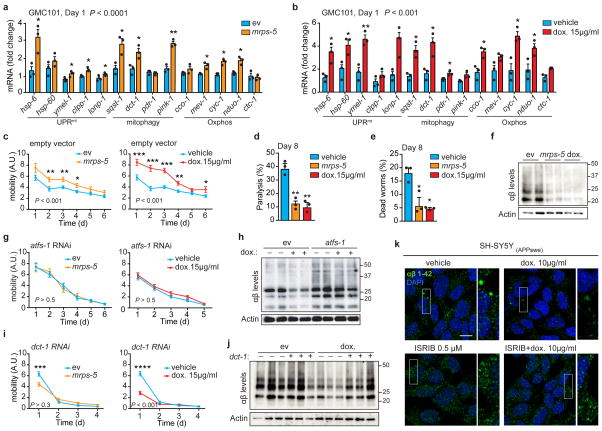
Figure 3. Inhibiting mitochondrial translation reduces Aβ proteotoxicity and aggregation in GMC101 worms and in cells.
a–b, MSR transcript levels in GMC101 fed mrps-5 RNAi or treated with dox (a and b, n=3 biologically independent samples). c, Mobility of GMC101 upon mrps-5 RNAi (n=35 worms) or dox treatment (n=54 worms). d–e, Percentage of paralyzed (d) and dead (e) D8 adult GMC101 worms after mrps-5 RNAi or dox treatment (n=3 independent experiments). f, Western-blot of amyloid aggregation in GMC101 upon mrps-5 RNAi or dox treatment (n=2 biologically independent samples). g, Mobility of GMC101 upon atfs-1 RNAi feeding (ev, n=54; mrps-5, n=49; dox, n=49 worms). h, Amyloid aggregation in dox-treated GMC101 upon atfs-1 RNAi (n=2 biological replicates). i, Mobility of GMC101 upon dct-1 RNAi (ev, n=44; dox, n=59; mrps-5, n=66 worms). ***P≤0.001 (P=0.0004); ****P≤0.0001. j, Amyloid aggregation in dox-treated GMC101 upon dct-1 RNAi (n=3 biologically independent samples). k, Confocal images of the SH-SY5Y neuroblastoma cell line stained with the anti-β-Amyloid 1-42, after dox and, where indicated, ISRIB treatments for 24 h. Scale bar, 10μm. See Methods for further details. Values in the figure are mean ± s.e.m. *P<0.05; **P≤0.01; ***P≤0.001; ****P≤0.0001. Throughout the figure, overall differences between conditions were assessed by two-way ANOVA. Differences for individual genes or two groups were assessed using two-tailed t tests (95% confidence interval). All experiments were performed independently at least twice. ev, scrambled RNAi; dox., doxycycline; A.U., arbitrary units; ISRIB, integrated stress response inhibitor. See also Extended Data Fig. 5. For uncropped gel source data, see Supplementary Fig. 1. For all the individual p values, see the Fig. 3 Spreadsheet file.

