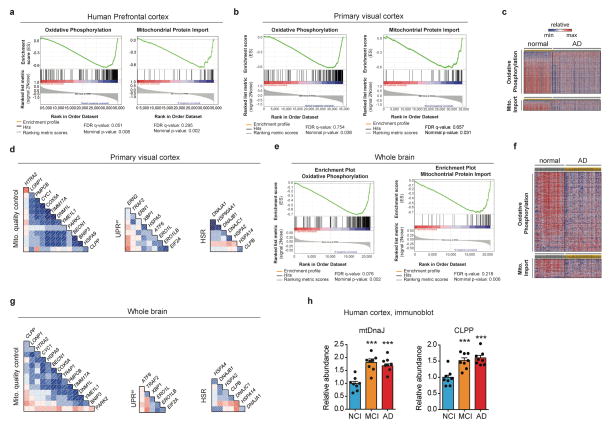
Extended Data Figure 1. Mitochondrial function pathways are perturbed in AD.
a, GSEA of Oxphos (FDR:0.051, nominal-P=0.008) and mitochondrial import (FDR:0.295, nominal-P=0.002) genes in human AD prefrontal cortex (GN328; normal, n=195; AD, n=388 individuals). b–g, GSEA of Oxphos (FDR:0.754, P=0.038) and mitochondrial import (FDR:0.657, P=0.031) genes in human Alzheimer visual cortex (GN327, n=195 normal and n=388 AD individuals) (b) and whole brain (GN314, n=16 normal and 33 AD individuals) (FDR:0.076, P=0.002 for Oxphos, FDR:0.218, P=0.006 for mitochondrial import) (e). Heatmaps of genes from visual cortex (c) and whole brain (f) datasets. Correlation plots of mitochondrial stress genes, UPRer and HSR levels in human visual cortex (d) and whole brain (g) from AD patients. For further information, see Supplementary Table 5. h, Quantification of immunoblots for mtDNaJ and CLPP (n=8 per group) from brains of humans with no cognitive impairment (NCI), mild-cognitive impairment (MCI) and mild/moderate AD. This experiment was performed independently twice. Values in the figure are mean ± s.e.m. ***P≤0.001. Differences were assessed using two-tailed t tests (95% confidence interval). Mito., mitochondrial. For all the individual p values, see the Extended Data Fig. 1 Spreadsheet file.

