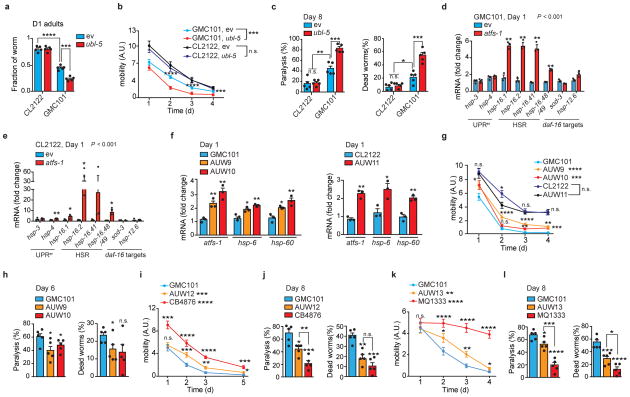
Extended Data Figure 4. Reliance on ubl-5 and on increased mitochondrial stress response of GMC101 worms.
a, Fraction of D1 adult worms fed with ubl-5 RNAi (n=5 biologically independent samples). b–c, Mobility of worms (b) and percentage of paralyzed and dead D8 adult worms (c) upon ubl-5 RNAi (b, CL2122, ev, n=39; ubl-5, n=43; GMC101, ev, n=40; ubl-5, n=41 worms; n for c, 5 biologically independent samples). d–e, Transcript analysis of UPRer, HSR and daf-16 target genes in GMC101 (d) and CL2122 (e) upon atfs-1 RNAi (n=3 biologically independent samples) f, Validation of the atfs-1 overexpressing strains AUW9, AUW10 and AUW11 (n=3 biologically independent samples). See also Methods. g, Worm mobility in atfs-1 overexpressing CL2122- and GMC101-derived lines (CL2122, n=40; GMC101, n=57; AUW9, n=40; AUW10, n=38; AUW11, n=42 worms). h, Percentage of paralyzed and dead D6 adult worms (n=5biologically independent samples). *P<0.05 (P=0.019,0.046,0.041). i–j, Mobility (i) and percentage of paralyzed and dead D8 adult (j) GMC101, clk-1 mutants (CB4876), and AUW12 (i, GMC101, n= 35; CB4876 n=42; AUW12, n=38 worms; n for j, 5 biologically independent samples). k–l, Mobility (k) and percentage of paralyzed and dead D8 adult (l) of GMC101, nuo-6 mutant (MQ1333), and AUW13 (k, GMC101, n=46; MQ1333 n=50; AUW13, n=47 worms; n for l, n=5 biologically independent samples). For further information on all these strains, see Methods section. ev, scrambled RNAi; A.U., arbitrary units. Values in the figure are mean ± s.e.m. *P<0.05; **P≤0.01; ***P≤0.001; ****P≤0.0001; n.s., non-significant. Throughout the figure, overall differences between conditions were assessed by two-way ANOVA. Differences for individual genes or two groups were assessed using two-tailed t tests (95% confidence interval). All experiments were performed independently at least twice. For uncropped gel source data, see Supplementary Fig. 1. For all the individual p values, see the Extended Data Fig. 4 Spreadsheet file.

