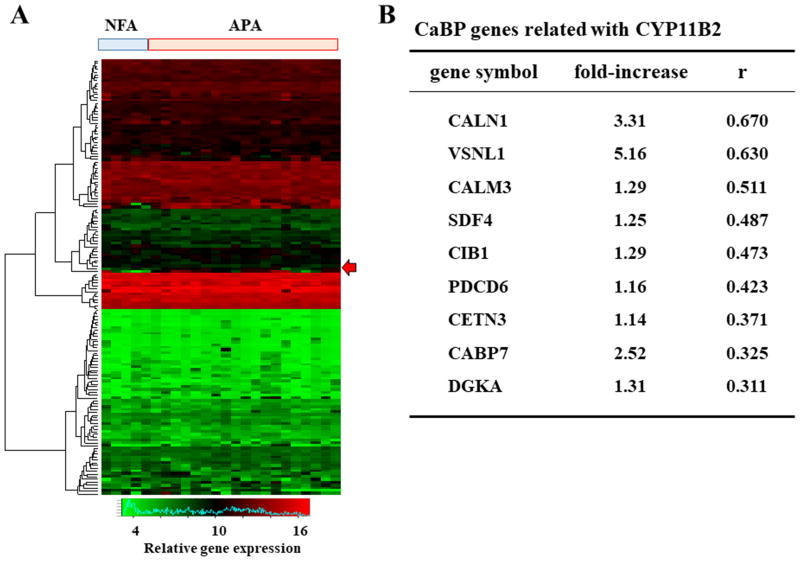
Figure 1.
(A) A heat map was generated from the microarray analysis of non-functioning adenoma (NFA; n=5) and aldosterone-producing adenoma (APA; n=19) samples. Genes encoding Ca2+ binding protein (CaBP) with EF-hand were used in the analysis. Arrow expresses CALN1 expression. (B) The expressions of CaBP-encoding genes in APA were described in the comparison with those in NFA. The relationships between CaBP genes and CYP11B2 expression were tested by Pearson's analysis, and arranged by descending order of correlation coefficient.

