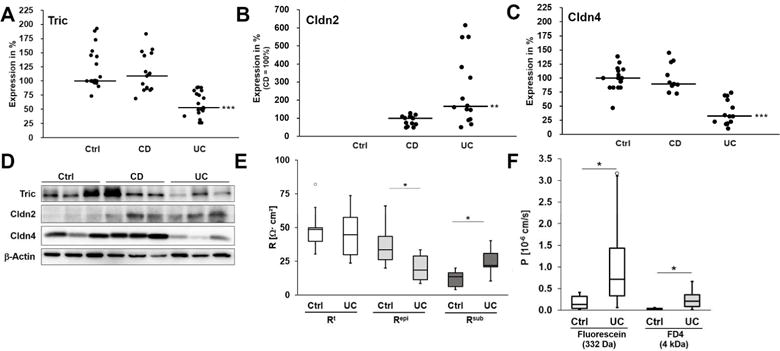
Fig. 1. Expression, functional and electrophysiological analysis of human biopsies.

A. Scatterplot of tricellulin protein expression in sigmoid colon biopsies of Ctrl, CD and UC. Median of Ctrl is set 100%. Tricellulin is downregulated in UC, while in CD no difference to controls occurs (median; Ctrl: 100.0%, n=20; CD: 108.6%, n=17; UC: 53.0%, n=19, ***p<0.001). B. Scatterplot of claudin-2 protein expression in sigmoid colon of Ctrl, CD and UC. Because Ctrl patients show no claudin-2 expression, the median of CD is set 100%. In both diseases claudin-2 is upregulated, however in UC this increase is higher than in CD (**p<0.01). C. Scatterplot of claudin-4 protein expression in sigmoid colon of Ctrl, CD and UC. Median of Ctrl is set 100%. Claudin-4 is downregulated in UC, while in CD no significant difference to Ctrl occurs (Ctrl: 100.0%, n=15; CD: 89.4%, n=11; UC: 32.3%, n=13, ***p<0.001). D. Representative western blot images of sigmoid colon tissue of Ctrl, CD and UC. E. Electrical resistances of sigmoid colon of Ctrl and UC (n=8). While the epithelial resistance (Repi) is decreased in UC (*p<0.05), the resistance of the subepithelial layers (Rsub) is increased (*p<0.05), resulting in an almost unchanged transepithelial resistance (Rt). F. Permeability for the paracellular flux markers fluorescein and 4 kDa-FITC dextran. Both permeabilities are increased in UC (fluorescein: Ctrl: 0.18±0.07·10−6 cm/s, n=6, UC: 1.07±0.41·10−6 cm/s, n=7, *p<0.05; FD4: Ctrl: 0.03±0.01·10−6 cm/s, n=6, UC: 0.26 ± 0.10·10−6 cm/s, n=6, *p<0.05).
