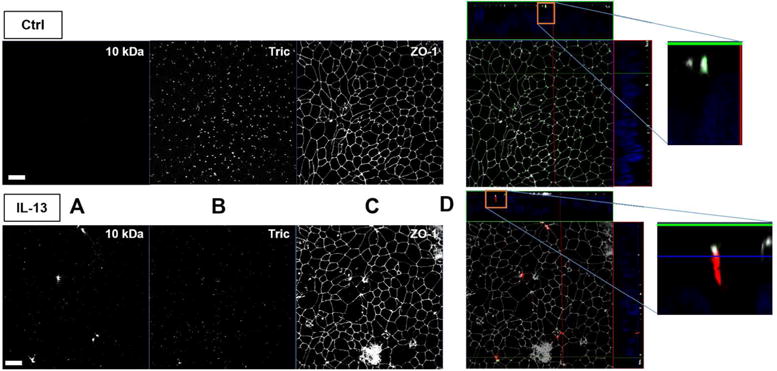
Fig. 8. Visualization of macromolecule passage sites by sandwich assay.

Maximum intensity projections and Z-stacks of HT-29/B6 immunofluorescence stainings. One out of four experiments is shown here, all yielding the same result. Cells were either untreated (upper panel) or treated with IL-13 (lower panel) and incubated basolaterally with avidin and then apically with biotin- and TRITC-labelled 10 kDa-dextran (A). Tricellulin (B) and ZO-1 (C) were counterstained for localization of the macromolecular passage. In merged views featuring Z-stacks and enlarged Z-stacks (D), 10 kDa dextran is shown in red, tricellulin in green, and ZO-1 in gray. IL-13 treatment results in decrease of tricellulin, while 10 kDa dextran appears predominantly at sites where more than two cells are in contact. For clearer evaluation of the localization of tricellulin, its signals were increased in contrast, while the ZO-1 signals were decreased in D. Bar = 20 μm.
