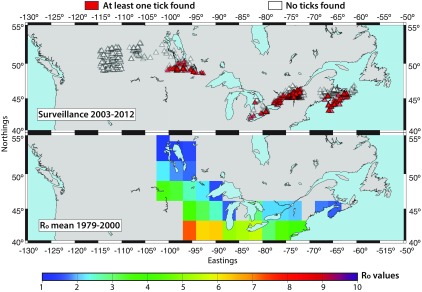
Figure 1.
Top: Data from active tick surveillance conducted between both 2003–2012 (Bouchard et al. 2015) and 2008–2013 (Ogden et al. 2014a). Locations where at least one I. scapularis tick has been found are marked by red triangles. White triangles mark locations where no I. scapularis ticks were collected. Bottom: Historical multimodel mean estimates for the period 1971–2000. The bar provides a color gradient showing the colors, which correspond to specific values. The numbers around both the top and bottom maps depict the northings and eastings associated with the domain.

