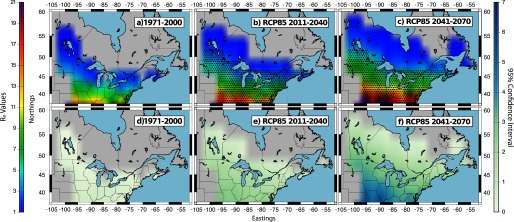
Figure 3.
Multimodel mean values for I. scapularis (maps a−c) and the climate model variability (95% confidence interval) (maps d−f) for the period 1971–2000 using the historical simulations and for the periods 2011–2040 and 2041–2070 using RCP8.5 simulations. values were mapped for areas east of the Rocky Mountains and for elevations below 500 m. The bar provides a color gradient showing the colors, which correspond to specific values. The numbers around the maps depict the Northings and Eastings associated with the domain. Black stippling in maps b and c shows the spatial distribution of statistically significant changes in between each future time period (2011–2040 and 2041–2070) and the historical time period 1971–2000. Statistical significance was calculated using the Kolmogorov-Smirnov test.

