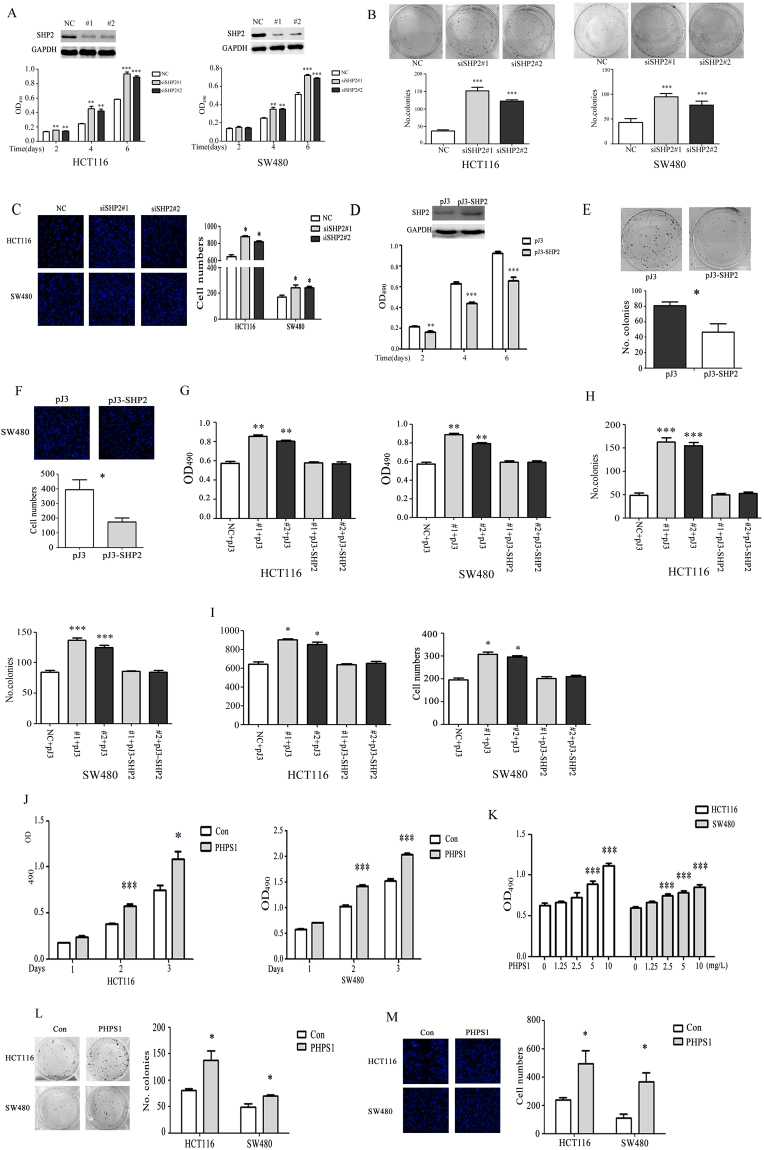
Figure 1.
SHP2 inhibits CRC cell proliferation and migration. (A) SHP2 knockdown by siSHP2#1 and #2 markedly increased the proliferation of HCT116 and SW480 cells. (B) Colony formation assays were conducted to estimate the growth rate of HCT116 and SW480 cells. SHP2 knockdown increased the colony numbers compared with the control group. Representative pictures of colonies (left) and quantification of colony numbers (right) are shown. (C) Transwell assay was performed to access the effect of SHP2 on cell migration by siRNA mediated knockdown. Representative pictures of cells (left) and quantification of cell numbers (right) are shown. (D) SW480 cells were transfected with pJ-SHP2 plasmid to overexpress SHP2 and the cell proliferation was accessed by MTT assay. (E) Colony formation assay was done by overexpression of SHP2 in SW480 cells. SHP2 overexpression decreased the colony numbers compared with the control group. Representative pictures of colonies (left) and quantification of colony numbers (right) are shown. (F) Transwell assay was performed to access the effect of SHP2 on cell migration by overexpressing SHP2 in SW480 cells. Representative pictures of cells (left) and quantification of cell numbers (right) are shown. Overexpression of SHP2 in HCT116 and SW480 cells rescued SHP2 knockdown induced cell proliferation (G), colony formation (H) and cell migration (I). (J and K) PHPS1 improved HCT116 and SW480 cell proliferation during 3 days in a time- and dose-dependent manner. (L) Cells were treated with PHPS1, and colony formation was measured after two weeks by crystal violet staining. PHPS1 increased the number of CRC cell colonies. (M)Transwell assay showing blockade of SHP2 phosphatase activity by PHPS1 improved CRC cell migratory ability. NC, non-silencing control siRNA. Values represent mean ± SEM (n = 3–4), *P ≤ 0.05, **P ≤ 0.01, ***P ≤ 0.001.

