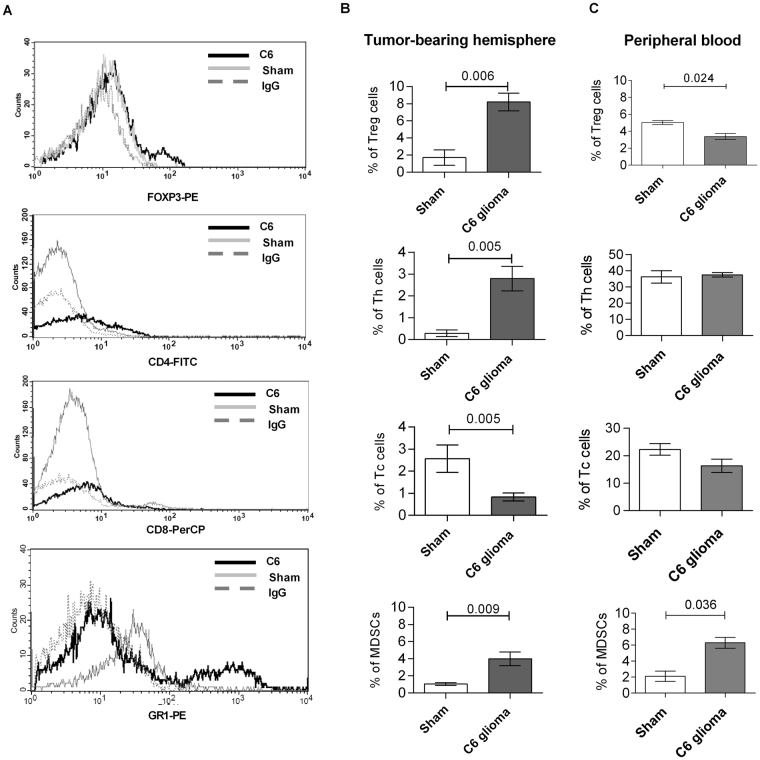
Figure 5.
Accumulation of MDSCs and T cell subpopulations in rat C6 gliomas. (A) Representative graphs show the analysis of percentages of T regulatory (FOXP3+), T helper (CD4+), T cytotoxic (CD8+) lymphocytes and MDSCs (GR1+ within CD11b+ cell population) in tumor-bearing hemispheres at the 21st day after C6 glioma cell implantation. Histograms from different subsets isolated from gliomas (dark lines), sham groups (light lines) and IgG control (dotted lines). (B) Quantification of percentage of specific cells among all counted cells isolated from sham-operated and tumor-bearing hemispheres at the 21st day after C6 glioma cell implantation (N ≥ 6 per group). (C) Quantification of percentage of specific cells among all counted cells isolated from peripheral blood of sham-operated and tumor-bearing animals (N ≥ 6 per group).

