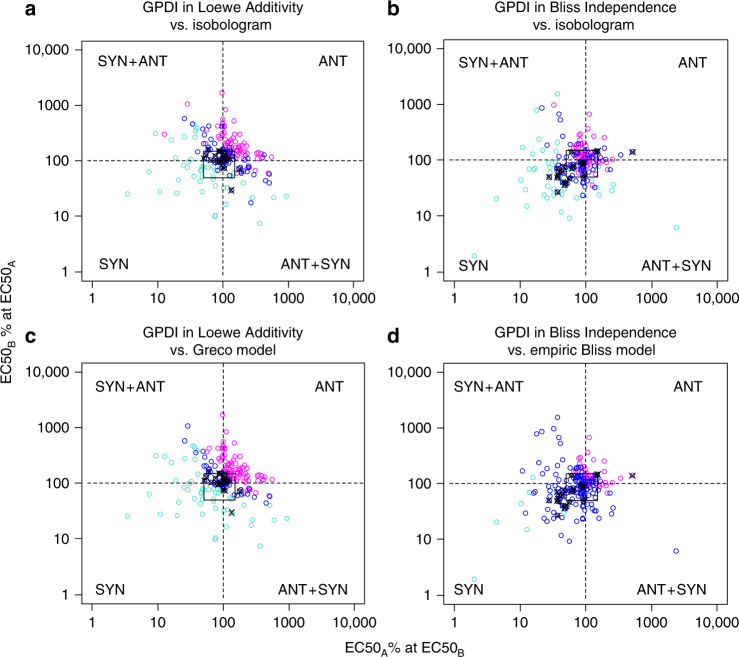
Fig. 3.
Distribution of the interaction parameters of the GPDI model. For simple interpretation, GPDI parameters are presented as %-change of the EC50 of the victim drug caused by the perpetrator drug at EC50 (points); dashed lines indicate additivity for Loewe Additivity (a, c), and Bliss Independence (b, d); the additivity margin (square) was determined from sham combinations (crossed points) with Loewe Additivity; the sectors indicate bidirectional synergy (SYN), bidirectional antagonism (ANT) or the two possible asymmetric interactions (SYN + ANT); color coding indicates result from corresponding conventional interaction analysis, i.e., isobologram (a, b), Greco model (c), and empiric Bliss model (d), and their determined interaction, i.e., synergy (turquoise), additivity (blue) or antagonism (magenta)

