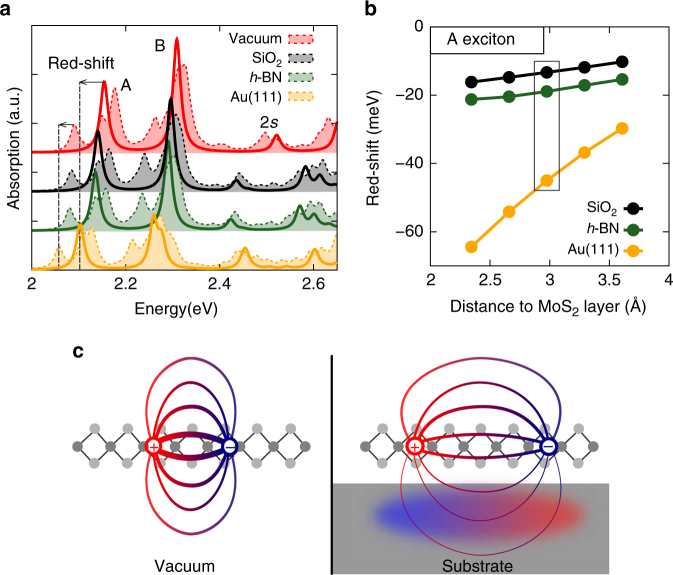
Fig.3.
Red-shift of optical transitions due to substrate screening. a Exciton (solid lines) and negative trion (dashed and filled lines) absorption spectra of an MoS2 monolayer in vacuum and on different substrates. Both spectra stem from a single calculation. The arrows indicate the red-shift in going from MoS2 in vacuum to a gold substrate. All substrates are placed at a distance of 3 Å and have a well-converged thickness of about 10 Å (i.e., increasing the substrate thickness by another layer of ~2 Å leads to an excitation shift of less than 0.5 meV). An artificial broadening of 0.01 eV is used. b Red-shift of the A exciton energy as a function of the distance to the substrate (using extrapolated values of N → ∞ in the k-mesh). The box marks the distance used in a. c Schematically illustration of a bound electron–hole pair in vacuum and on a substrate, where the Coulomb interaction is screened and the substrate is polarized

