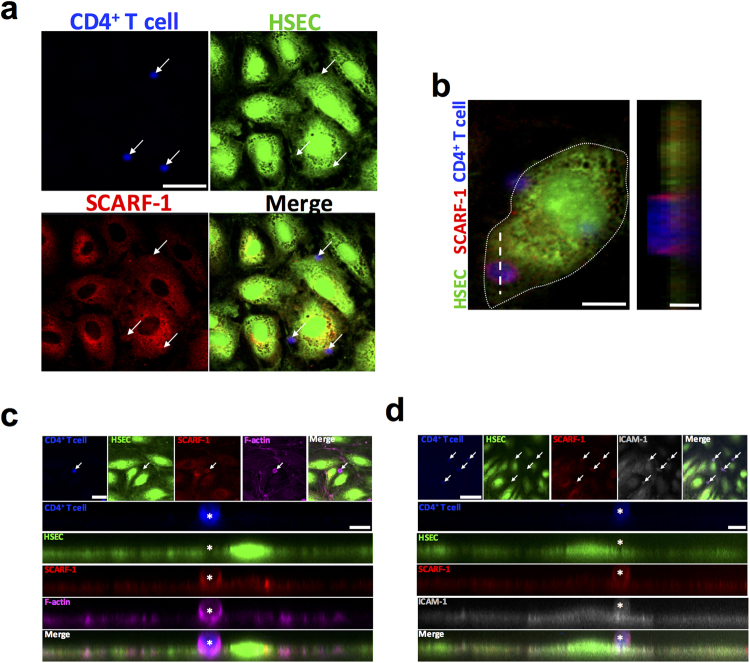
Figure 5.
SCARF-1 forms an adhesive cup for CD4+ T cell adherence to HSEC. (a–d) Representative image of CD4+ T cells (blue; Cell Trace Violet (CTV)-labelled) attached to TNFα-stimulated HSEC (green; Cell Tracker Green (CTG)-labelled) via SCARF-1 (red) adhesive cups, which are rich in (c) filamentous (F-)actin (pink) and (d) ICAM-1 (grey). (a) White arrows highlight adherent CD4+ T lymphocytes. Scale bar = 40 µm. (b) White dotted line represents the periphery of the HSEC and the white dashed line delineates the site of the Z stack. Scale bars = 12 µm (left) and 2 µm (right). (c) White arrow highlights adherent CD4+ T lymphocyte. Scale bars = 22.5 µm (top left) and 7 µm (right). (d) White arrows highlight adherent CD4+ T lymphocytes. Scale bars = 50 µm (top left) and 5 µm (right). (c and d) White asterisks indicate adherent CD4+ T lymphocyte in adhesive cup.

