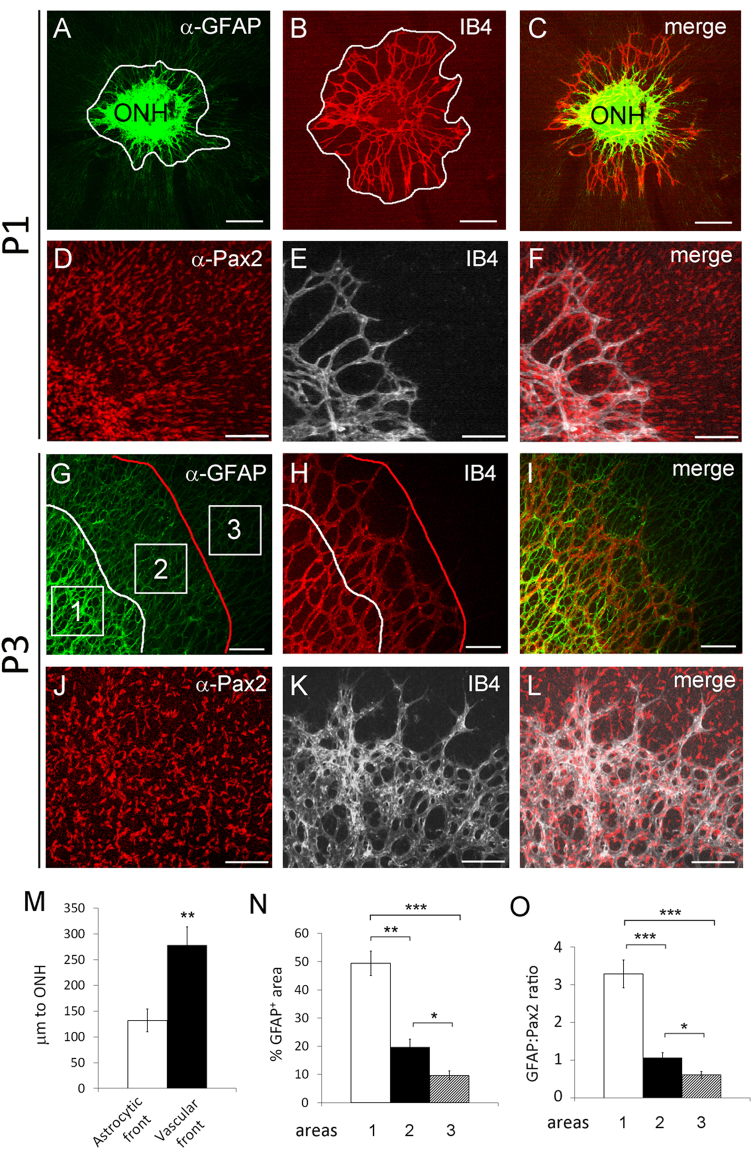
Figure 3.
Relative positions of astrocytes and blood vessels in normal neonatal retinas at P3. Retinas were dissected at P1 and P3, fixed in 4% PFA, and subject to whole-mount IB4 or IF staining for Pax2 and GFAP expression. Flat-mount confocal images are shown in (A–F) (P1) and (G–L) (P3). Blood vessels were stained with IB4-Alexa Fluor® 594 (B and H) or IB4- Alexa Fluor® 647 (E and K). Curvy white lines in A and G mark the astrocytic front. The white line in (B) and the red line in (H) mark the vascular front. (M) distances between the astrocytic or vascular front and the edge of the ONH (µm to ONH). N and (O), quantification of astrocytic differentiation in areas 1, 2, and 3 (squares in G). n = 4. *p < 0.05; **p < 0.01; ***p < 0.001. Error bars are SEM. Scale bars: (A–C) and (G–I), 200 µm; (D–F) and (J–L), 100 µm.

