Figure 7.
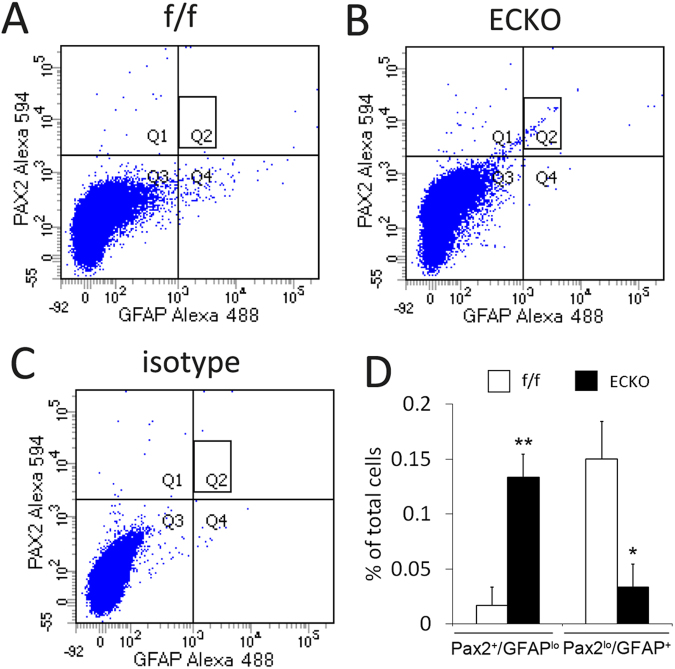
Quantification of astrocytic differentiation in floxed (f/f) and Vegfr-2 ECKO mice by flow cytometry. Single cell suspensions were prepared from P5 retinas, briefly fixed and permeabilized. Cells were then incubated with rabbit anti-mouse Pax2, rat anti-mouse GFAP, or isotype controls, followed by goat anti-rabbit IgG-Alexa Fluor® 594 and goat anti-rat IgG-Alexa Fluor® 488. Stained cells were washed, and subject to flow cytometry analysis. (A) Floxed mice (f/f); (B), Vegfr-2 ECKO mice (C) an example of isotype control using cells from floxed mice. For quantification, background events in isotype controls were subtracted from corresponding values in floxed or Vegfr-2 ECKO samples. Quantification of Pax2+/GFAPlo (Q1) and GFAP+/Pax2lo events (Q4) are presented in D. Also note a subpopulation of cells in Vegfr-2 ECKO mice exhibiting intermediate staining intensities for both Pax2 and GFAP (B, rectangle in Q2). Similar cells were virtually absent in floxed mice (A, rectangle in Q2). *p < 0.05, **p < 0.01. Errors are shown as SEM.

