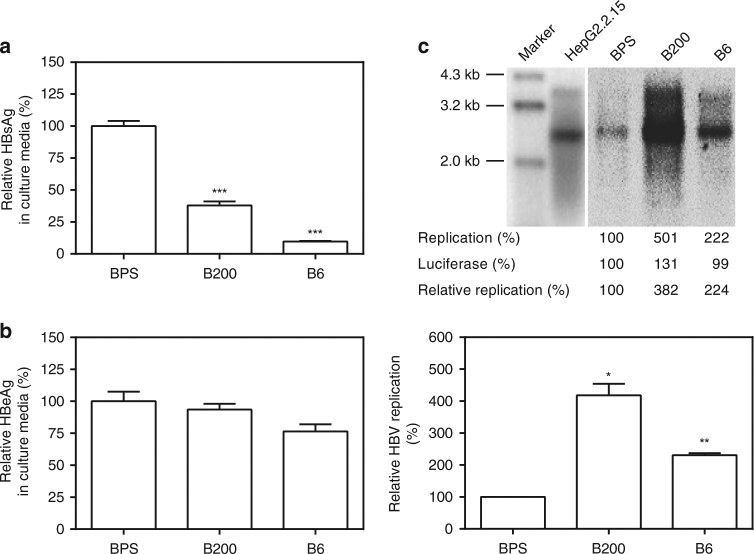
Fig. 2.
Comparison of viral expression and replication of BPS, B6 and B200 in vitro. HBV HDI plasmids were transfected into Huh-7 cells and culture supernatants at 48 h post transfection were assayed for HBsAg (a) and HBeAg (b) by ELISA. Intracellular capsid-associated HBV DNA was analysed in Southern blot (c, top panel), and quantified using densitometry scanning (c, bottom panel). HepG2.2.15 was analysed in parallel as signal position control. Transfection efficiency was normalised by measuring luciferase expressed from co-transfected pGL3 plasmid and data were normalised taking BPS measurements as 1. Transfections were performed in triplicates and repeated twice independently. Means and s.e.m. of the two repeats are plotted. c (top) shows representative Southern blot results. Statistical significance was calculated using unpaired two-tailed t-test (a, b, c, bottom panel). *p < 0.05; **p < 0.01; ***p < 0.001

