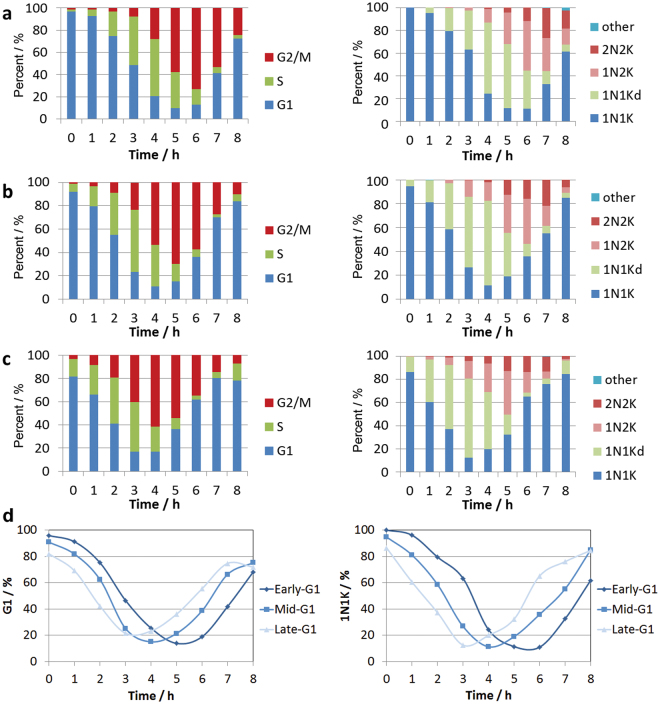
Figure 3.
Flow cytometry time-course of distinct G1 synchronised Pcf T. brucei. (a) Early-G1 cells (97% G1) eluted at 18 ml/min, (b) Mid-G1 cells (92% G1) eluted at 20 ml/min, (c) Late-G1 cells (82% G1) eluted at 22 ml/min. (d) Direct comparison of the proportion of G1 (left) and 1N1K cells (right) over time for the Early-, Mid- and Late-G1 fractions. Left panel - Flow cytometry of PI stained cells at hourly intervals post elutriation (n = 50,000 per time point). Right panel – Microscopy of DAPI stained cells (n > 200 per time point).

