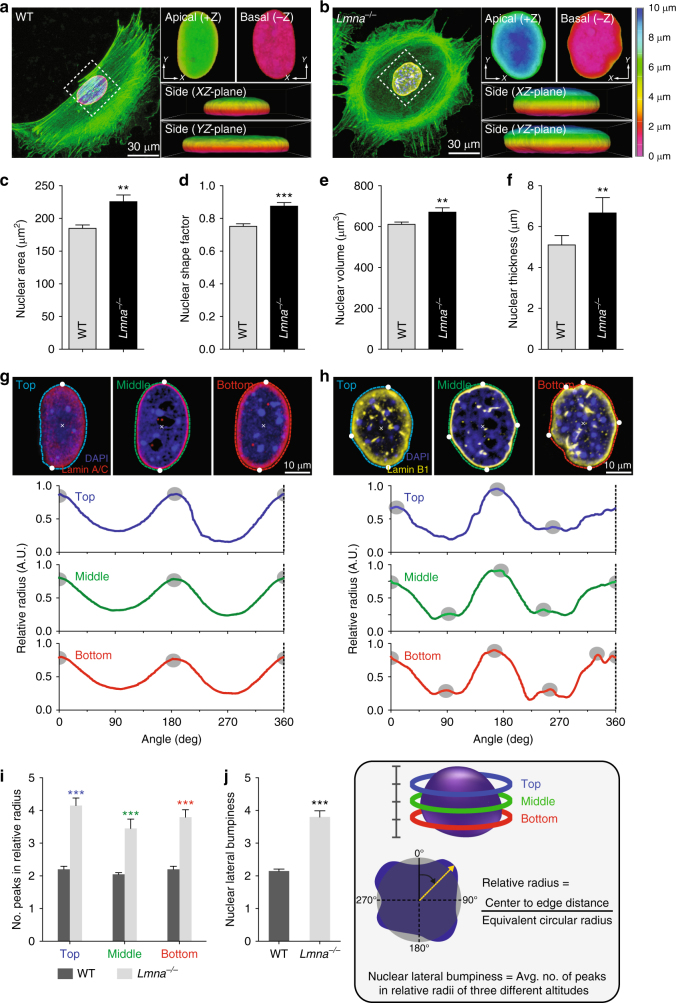
Fig. 2.
Effect of nuclear lamin A/C on nuclear morphology. a–f Lamin A/C-dependent difference of nuclear morphology in MEFs placed in a glass bottom dish. Representative cell and nuclear morphology in lamin A/C-present control wild-type (WT) and lamin A/C-deficient Lmna knockout (Lmna−/−) MEFs were captured by 3D reconstruction of immunofluorescence confocal images along the z-axis (a, b). Note that apical, basal, and side views of pseudo-colored 3D z-depth rendered nuclei display the differences in the nuclear surface textures. Lmna−/− cells displayed more spread (c), rounder (d), larger (e), and thicker (f) nuclei than the WT control cells. g–j Comparison of lamin A/C-dependent lateral deformation of the nucleus. Tracking surface contours in three different altitudes in a nucleus displays significantly more peak positions (gray dots) in Lmna−/− cells than WT cells (g–i), representing more protrusions on the nuclear surface of the Lmna−/− MEFs. Relative radius is the ratio between the nuclear center-to-edge distance and the equivalent circular radius, where top (blue), middle (green), and bottom (red) parts correspond to the top 25%, top 50%, and top 75% positions along the z-axis of the nucleus, respectively. Average number of peaks in relative radii of three different altitudes was termed by the nuclear lateral bumpiness (j). In c–j, >30 cells were analyzed per condition. Error bars represent S.E.M. of averaged values and statistical differences were calculated using the unpaired t-test; ***p < 0.0001, **p < 0.001

