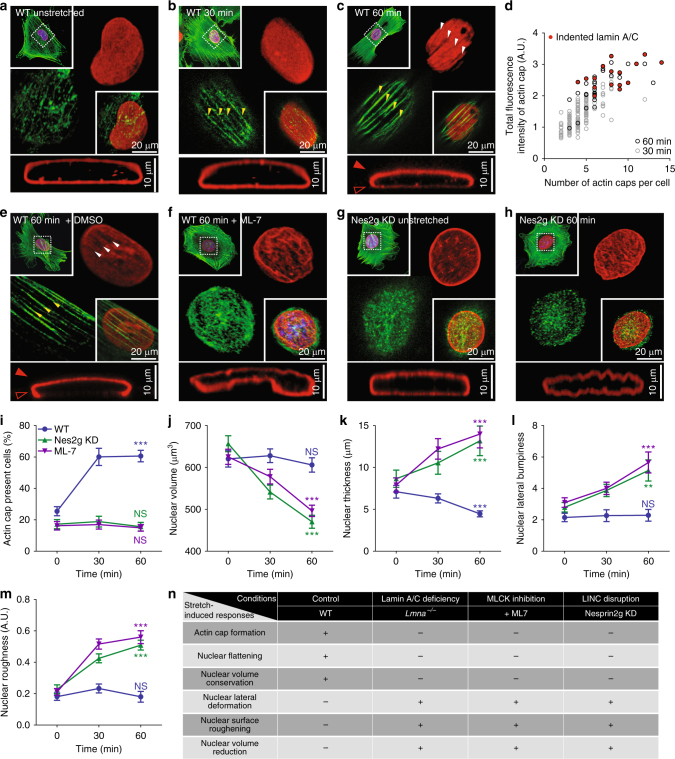
Fig. 4.
Underlying molecular mechanism of nuclear deformation. a–d Substrate stretching induced formation of an actin cap and reorganization of the nuclear lamin A/C. Although unstretched MEFs placed on the compliant PDMS film typically displayed a dismantled actin cap and vertically isotropic organization of the lamin A/C (red) wrapping the thick nucleus (a), continuous substrate stretching induces the formation of apical actin stress fibers (>30 min, b, c) and the nucleus became flattened (60 min, c). Note that the prolonged stretching time induces thickening of the stress fibers in the actin cap (b–d) and the formation of indented marks on the lamin A/C-stained apical surface of the nucleus along the actin cap (c, d), where lamin A/C forms an apically polarized dorm structure (b vs. c). Indented marks on lamin A/C were detected only after 60 min of stretching (c, d). e–h Two molecular mechanisms of stretch-induced nuclear morphological responses: actomyosin contractility and nucleus-cytoskeletal connectivity. Although lamin A/C was present, treatment of a myosin light-chain kinase (MLCK) inhibiting drug, ML-7 (e vs. f) and depletion of nesprin-2G (Nes2g) proteins (g vs. h) abrogated the stretching induced formation of an actin cap, where severe nuclear deformation was detected in response to substrate stretching (f, h). i–m Quantification of the actin cap formation and nuclear morphology of ML-7 treated (purple) and nesprin-2G depleted (green) MEFs in response to the substrate stretching. Note that the loss of actomyosin contractility or nucleus-cytoskeletal connectivity did not induce the formation of an actin cap (i) but reduced the nuclear volume (j), where severe nuclear morphological deformation was detected (k–m) in response to substrate stretching. n Summary of the relationship between the actin cap formation and nuclear morphological responses. In i, >150 cells were examined per condition and in j–m, >30 lamin B1-stained nuclei were analyzed per condition. Error bars represent S.E.M. of averaged values and statistical differences were calculated by unpaired t-test between unstretched control cells (0 min) and fully stretched cells (60 min). ***p < 0.0001, **p < 0.001, NS not significant (p > 0.05)

