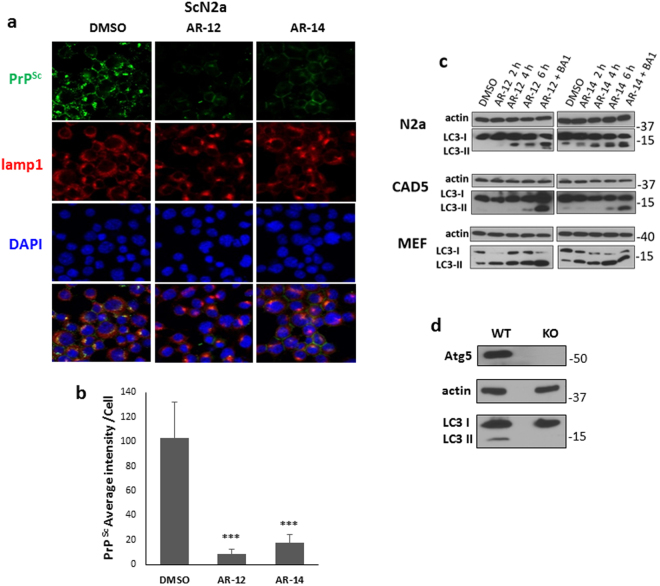
Figure 3.
Immunofluorescence analysis of AR-12 and AR-14 effects and induction of autophagy. (a) ScN2a cells were treated with AR-12 or AR-14 for 72 h. DMSO-treated cells were used as a control. Cells were fixed and confocal microscopy staining for PrPSc (mAb 4H11, green) and lamp1 (red) was done. Nuclei were stained with DAPI (blue). Lower panel shows merge. (b) The overall immunofluorescence intensity of PrPSc of five images for either DMSO, AR-12 or AR-14 treated cells was measured. Overall intensity was divided by the cell number contained from the same image quantified by ImageJ “analyze particle” command to calculate the averaged immunofluorescence intensity per cell. (c) N2a, CAD5 and MEF cells were treated with AR-12 (3 µM) or AR-14 (2 µM), respectively, for 2, 4 and 6 h, or AR compound plus Bafilomycin A1 (BA1) (100 nm, for 4 h). Solvent only-treated cells (DMSO) were used as control. Immunoblots were developed with anti-LC3 mAb (autophagy marker) and mAb for actin (gel loading control). Treatment both with AR-12 and AR-14 showed a time dependent increase in LC3-II levels. BA1 treated cells had the highest expression level of LC3-II due to the block on autophagic flux and lysosomal function. (d) N2a cells were established with knock-out in the autophagy gene ATG5. Immunoblot compares N2a knockout (KO) to wild-type (WT) cells. Immunoblot was probed for Atg5, LC3-I/II and actin. There are no Atg5 and LC3-II bands in N2a-KO cells.

