Figure 3.
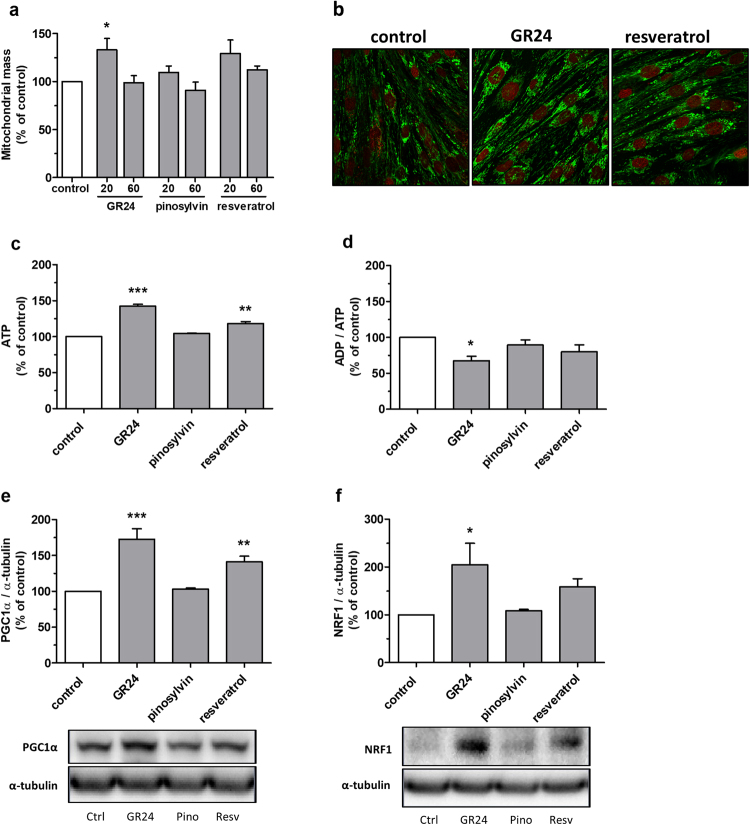
GR24 stimulates mitochondrial biogenesis, upregulates mitochondrial regulators and increases ATP production. (a) Plate reader assay of mitochondrial mass. L6 myotubes were treated with 20 µM or 60 µM test compounds (grey bars) or with DMSO (white bar) for 24 h. The mitochondria were stained with MitoTracker Green FM and the fluorescence was quantified with a plate reader. Bars represent the mean ± SEM of three independent experiments. *p < 0.05 vs control. (b) Fluorescent microscopic images of L6 myotubes treated with 20 µM test compounds or with DMSO for 24 h. The mitochondria were visualized with MitoTracker Green FM (green) and the nuclei with DRAQ5 (red). (c–f) L6 myotubes were treated with 60 µM test compounds (grey bars) or with DMSO (white bar) for 24 h. (c) ATP concentration and (d) ADP/ATP ratio were quantified spectrophotometrically. (c,d) Bars represent the mean ± SEM of two independent experiments. *p < 0.05, **p < 0.01 and ***p < 0.001 vs control. (e) PGC1α expression was analysed by western blotting; bars represent the quantification results of PGC1α normalised with α-tubulin. (f) NRF1 expression was analysed by western blotting; bars represent the quantification results of NRF1 normalised with α-tubulin. (e,f) Bars represent the mean ± SEM of three independent experiments. *p < 0.05, **p < 0.01 and ***p < 0.001 vs control. Representative western blots are shown below. Full-length blots are presented in Supplementary information. α-tubulin was detected from the same membranes after stripping and reprobing.

