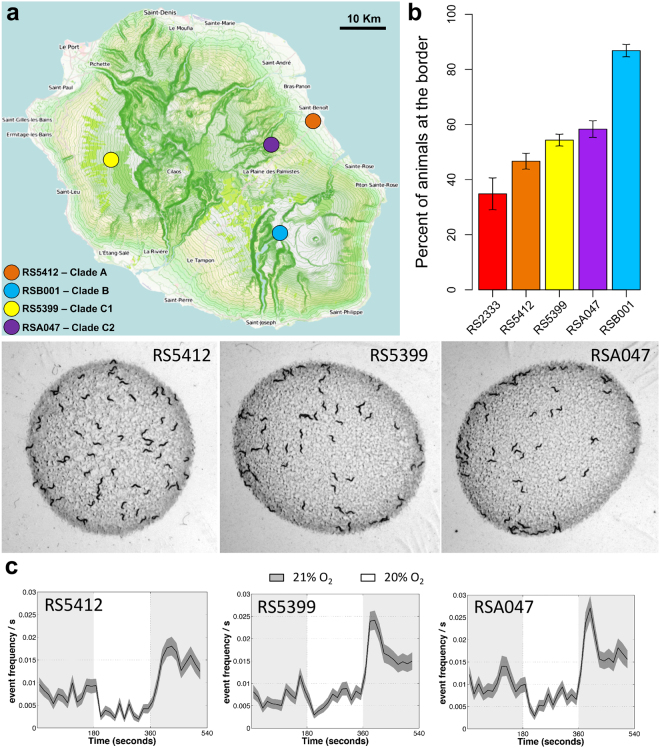
Figure 2.
Omega-turn locomotive response in solitary P. pacificus strains. (a) Locations on La Réunion Island from which the selected solitary strains have been isolated (modified from OpenStreetMap® under the Open Database License (ODbL), © OpenStreetMap contributors (https://www.openstreetmap.org/copyright)). (b) Bordering behaviour of selected P. pacificus solitary strains. (c) Ω-turn rate response to 21% −>20% −>21% oxygen shifts on a lawn of E. coli OP50 in selected P. pacificus solitary strains. In all graphs, the black line represents the mean Ω-turn and the grey area, the S.E.M. For statistical analysis see Suppl. Table S3.

