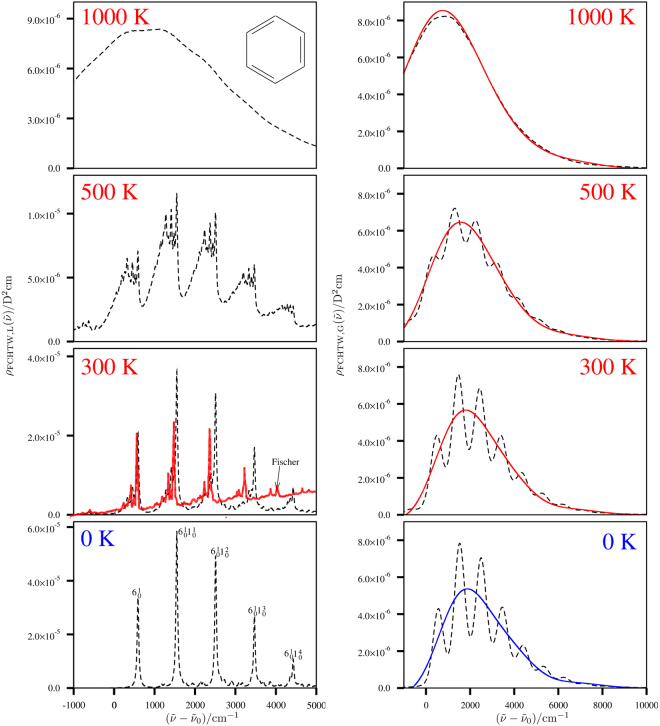
Figure 1.
Left part of the figure: The dashed lines are drawn for the TCF-FFT approach with a Lorentzian line shape function with FWHM of 50 cm−1. A time increment Δt of 0.51 fs and a grid with 216 grid points are used for the corresponding FFT calculations. The experimental UV absorption spectrum as reported by Fischer in ref.37 is additionally shown in red, which has been adapted from ref.37 and shifted to match approximately the position of the major peak in the region below the 0–0 transition wavenumber and rescaled to have similar peak height as the one computed for the transition. Right part of the figure: The dashed lines are drawn for the TCF-FFT approach with a Gaussian line shape function of with FWHM of 500 cm−1. A time increment of 0.10 fs and a grid with 215 grid points are used for the corresponding FFT calculations. Solid lines are drawn for the curve obtained by Edgeworth expansion using up to 4-th order cumulants and, for 1000 K by Edgeworth expansion using up to 8-th order cumulants.

