Fig. 1.
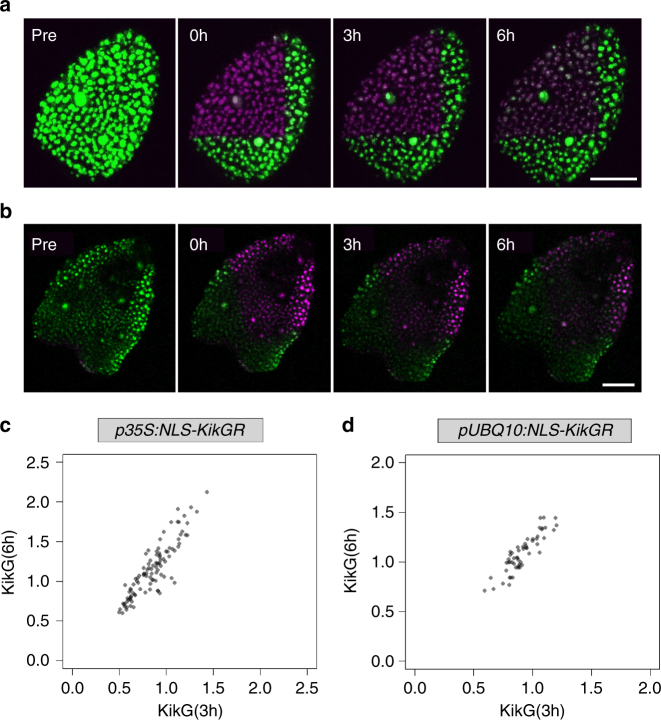
Temporal analysis of fluctuation in p35S:NLS-KikGR and pUBQ10:NLS-KikGR lines. a Confocal laser scanning microscopy (CLSM) images of p35S:NLS-KikGR before (pre) and after conversion (0 h, 3 h and 6 h). b CLSM images of pUBQ10:NLS-KikGR before (pre) and after conversion (0 h, 3 h and 6 h). Scale bar: 50 µm. c Scatter plot of p35S:NLS-KikG expressing cells (n = 103) obtained from one representative leaf. The normalized mean fluorescence intensity of the cells at 3 h is plotted against the normalized mean fluorescence intensity of the cells at 6 h. Data points are shown in grey, overlapping data points appear black. d Scatter plot of pUBQ10:NLS-KikG expressing cells (n = 55) obtained from one representative leaf

