
Fig. 2.
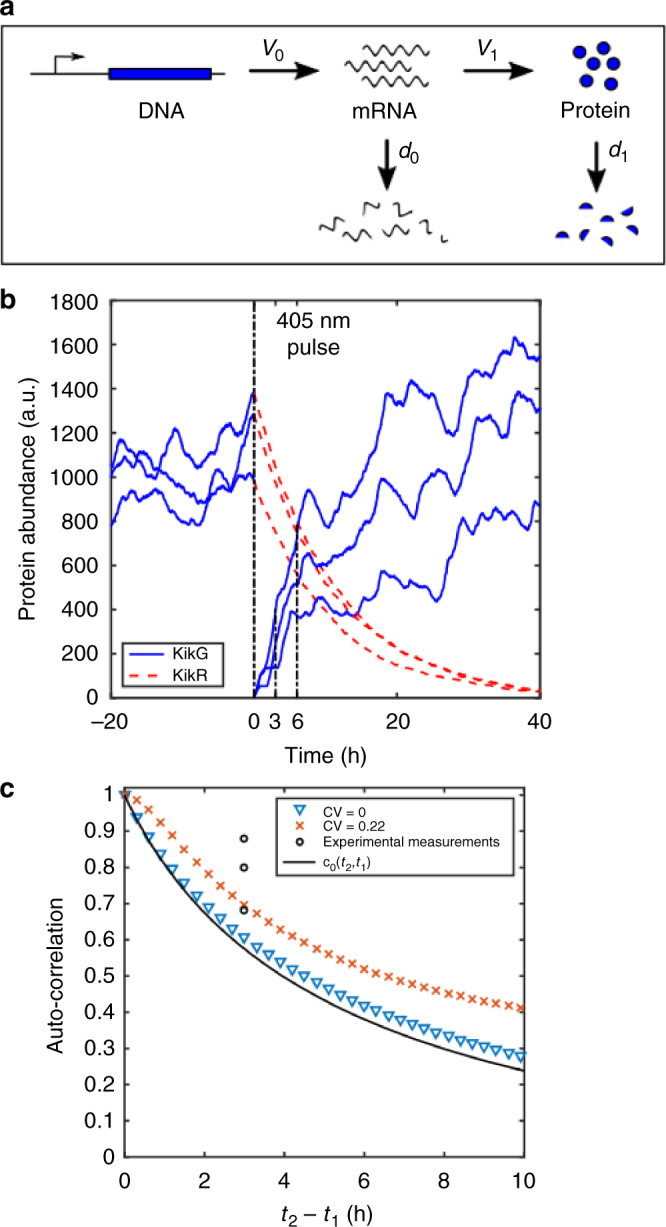
Theoretical analysis of fluctuations. a Schematic illustration of the two-stage stochastic gene expression model. v = production rate, d = degradation rate. (b) Modelling of three stochastic realizations of the KikGR reporter. After a 405 nm pulse the green fluorescence-emitting KikG is transformed into red fluorescence-emitting KikR. The auto-correlation between KikG at 3 h and 6 h is calculated. Parameters are: ν0 = 2.25 h−1, d0 = 1.125 h−1, d 1 = 0.09 h−1 and ν 1 = 41.825 h−1, ν 1 = 48.506 h−1, ν 1 = 46.069 h−1 for the three different trajectories. (c) Modelling of the non-stationary auto-correlation of the two-stage gene expression model in presence of extrinsic noise (crosses and triangles) as calculated from stochastic simulation of the KikGR reporter from 105 trajectories (Supplementary Note 1) and the theoretical non-stationary auto-correlation of a birth-death process c0(t 2, t 1) (black solid line) as a lower bound of the non-stationary auto-correlation (Supplementary Note 1). The extrinsic noise is simulated as cell-to-cell variations in the protein translation rate ν 1 with different coefficients of variation (CV). Parameters for the two-stage model are: ν 0 = 2.25 h−1, d 0 = 1.125 h−1, d 1 = 0.09 h−1 and <ν 1 > = 45 h−1. In the case of no extrinsic noise (Var(ν 1) = 0 h−2, blue triangles), the auto-correlation of the two-stage model approaches that of the birth-death model. With increasing extrinsic noise (Var(ν 1) = 100 h−2, red crosses) the auto-correlation increases. The reason for this is that the covariance and the variance become dominated by the extrinsic noise, for which a much longer correlation time was assumed