
Fig. 3.
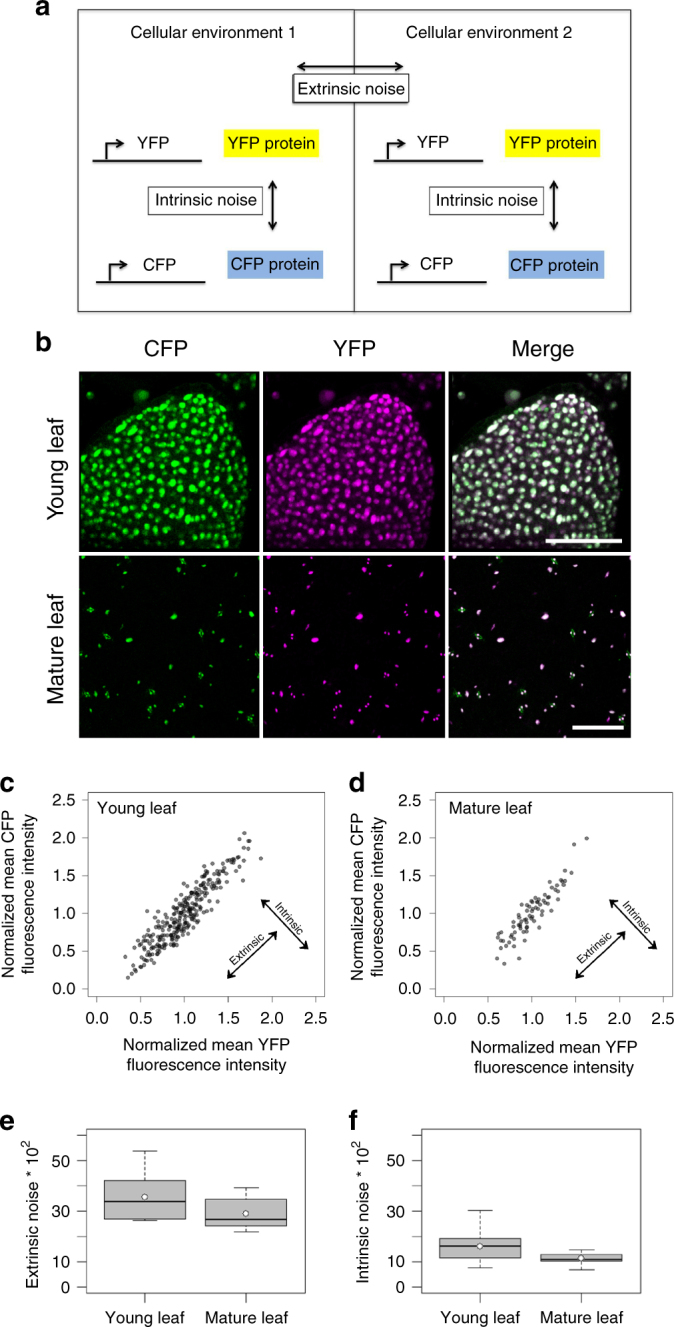
Intrinsic and extrinsic noise in young and mature rosette leaves of p35S:2xNLS-YFP p35S:2xNLS-CFP plants. a Schematic illustration of the experimental setup to determine the intrinsic and extrinsic noise. b CLSM images of a young, developing leaf and a mature leaf of a p35S:2xNLS-YFP p35S:2xNLS-CFP line. CFP is shown in green, YFP in magenta and the same fluorescence levels of both is indicated in white. Note, stomata show autofluorescence in the CFP channel. Scale bars: 50 µm (young leaf) and 100 µm (mature leaf). c Scatter plot of the normalized CFP mean fluorescence intensity plotted against the normalized YFP mean fluorescence intensity of single cells in one representative young leaf (n = 284). Pearson’s correlation coefficient = 0.914, Spearman's correlations coefficient = 0.905. Data points are shown in grey, overlapping data points appear black. d Scatter plot of the normalized CFP mean fluorescence intensity plotted against the normalized YFP mean fluorescence intensity of single cells in one representative mature leaf (n = 76). Pearson's correlation coefficient = 0.909, Spearman's correlation coefficient = 0.906. e Box plot of extrinsic noise measurements of young (n = 10 leaves with a total number of 2219 cells, median = 33.5) and mature leaves (n = 10 leaves with a total number of 757 cells, median = 26.6). The extrinsic noise was slightly but not significantly higher in young leaves as compared to mature leaves (p = 0.075 Wilcoxon rank-sum test). f Box plot of intrinsic noise measurements of young (n = 10 leaves with a total number of 2219 cells, median = 16.1) and mature leaves (n = 10 leaves with a total number of 757 cells, median = 10.8). The intrinsic noise was significantly higher in young leaves (p = 0.029 Wilcoxon rank-sum test). Boxes show 25th and 75th percentiles and median. White dots show mean values