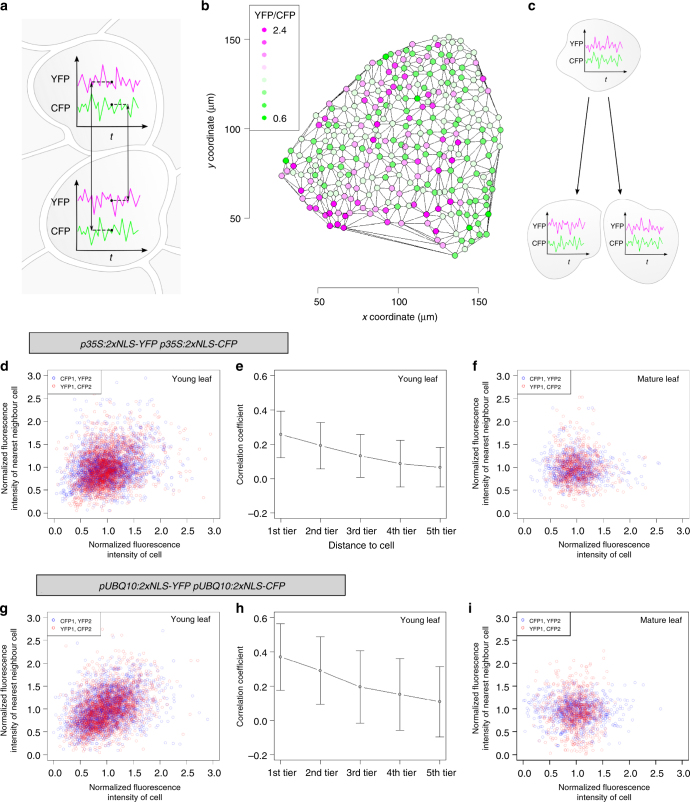
Fig. 5.
Nearest neighbour analysis of p35S:2xNLS-YFP p35S:2xNLS-CFP and pUBQ10:2xNLS-YFP pUBQ10:2xNLS-CFP plants. a Schematic illustration of the experimental setup to determine the cofluctuation of neighbouring cells. b Leaf area depicting the cell-to-cell variability of noise based on the YFP/CFP ratios in each cell. Colours show the YFP/CFP ratios as indicated in the legend. c Schematic illustration of the effect of cell division on cofluctuation. d Scatter plot of p35S:2xNLS-YFP p35S:2xNLS-CFP young leaves showing the normalized fluorescence intensities of cells plotted against the normalized fluorescence intensity of the nearest neighbour of the considered cells (neighbour cell with the lowest distance). Blue circles indicate the CFP fluorescence intensity of a cell (CFP1) plotted against the YFP fluorescence intensity of the nearest neighbouring cell (YFP2). Red circles show the YFP fluorescence intensity of a cell (YFP1) plotted against the CFP fluorescence intensity of the nearest neighbouring cell (CFP2) (n = 2219 cells; r = 0.341; p = 0.0002, randomization test). e Mutual dependency of the distance to the neighbouring cell and the cofluctuation in young rosette leaves of p35S:2xNLS-YFP p35S:2xNLS-CFP. Neighbouring cells were grouped into five tiers according to their distance (cell diameters) to the considered cell. Mean values and standard deviations are shown (n = 86,541 neighbourhood analyses (2219 cells×39 cells)). (f) Scatter plot of p35S:2xNLS-YFP p35S:2xNLS-CFP mature rosette leaves showing the normalized fluorescence intensities of cells plotted against the normalized fluorescence intensity of the nearest neighbour (n = 757 cells; r = 0.02; p = 0.433, randomization test). g Scatter plot of pUBQ10:2xNLS-YFP pUBQ10:2xNLS-CFP young rosette leaves showing the normalized fluorescence intensities of cells plotted against the normalized fluorescence intensity of the nearest neighbour (n = 2021 cells; r = 0.413; p = 0.0003, randomization test). h Mutual dependency of the distance to the neighbouring cell and the cofluctuation in young rosette leaves of pUBQ10:2xNLS-YFP pUBQ10:2xNLS-CFP. Neighbouring cells were grouped into five tiers according to their distance (cell diameters) to the considered cell. Mean values and standard deviations are shown (n = 78,819 neighbourhood analyses (2021 cells×39 neighbouring cells)). (i) Scatter plot of pUBQ10:2xNLS-YFP pUBQ10:2xNLS-CFP mature rosette leaves showing the normalized fluorescence intensities of cells plotted against the normalized fluorescence intensity of the nearest neighbour (n = 775 cells; r = −0.06; p = 0.681, randomization test)

