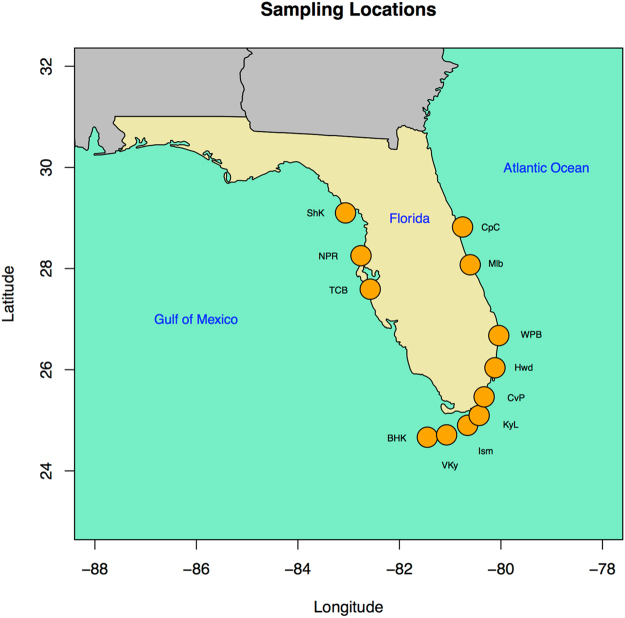
Figure 1.
The 12 sampling locations (each with eight individuals) are indicated by orange circles. Sampling location codes are provided in Table 1. The map was generated using R (citation: R Core Team (2013). R: A language and environment for statistical computing. R Foundation for Statistical Computing, Vienna, Austria. http://www.R-project.org/), and the R package ‘maps’ (citation: Original S code by Richard A. Becker, Allan R. Wilks. R version by Ray Brownrigg. Enhancements by Thomas P Minka and Alex Deckmyn. (2017). maps: Draw Geographical Maps. R package version 3.2.0. https://CRAN.R-project.org/package=maps).

