Table 4.
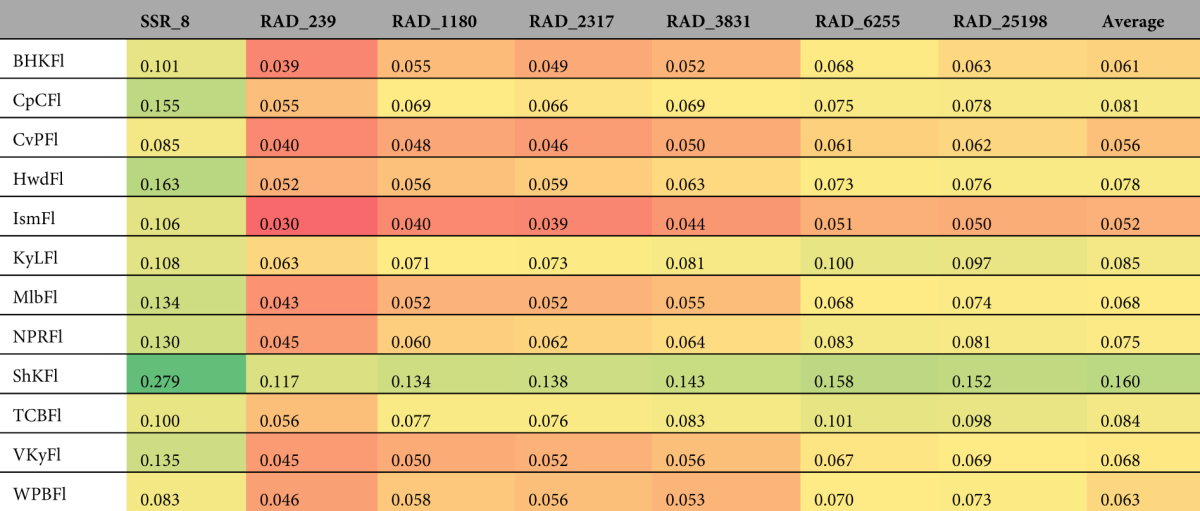
Pairwise F ST for each sampling location (i.e., one sampling location versus all others) for each of the seven datasets. Within each data set, lower (warmer colors) and higher (cooler colors) values of F ST are shown using color-coding.

Pairwise F ST for each sampling location (i.e., one sampling location versus all others) for each of the seven datasets. Within each data set, lower (warmer colors) and higher (cooler colors) values of F ST are shown using color-coding.
