
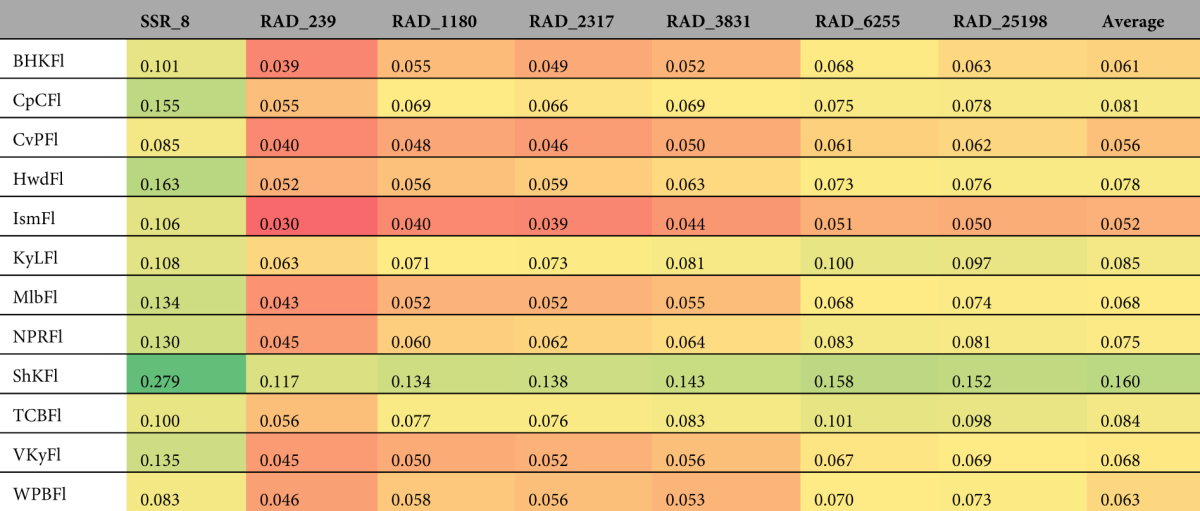
Table 4.
Pairwise F ST for each sampling location (i.e., one sampling location versus all others) for each of the seven datasets. Within each data set, lower (warmer colors) and higher (cooler colors) values of F ST are shown using color-coding.
Official websites use .gov
A
.gov website belongs to an official
government organization in the United States.
Secure .gov websites use HTTPS
A lock (
) or https:// means you've safely
connected to the .gov website. Share sensitive
information only on official, secure websites.
Pairwise F ST for each sampling location (i.e., one sampling location versus all others) for each of the seven datasets. Within each data set, lower (warmer colors) and higher (cooler colors) values of F ST are shown using color-coding.