Figure 1.
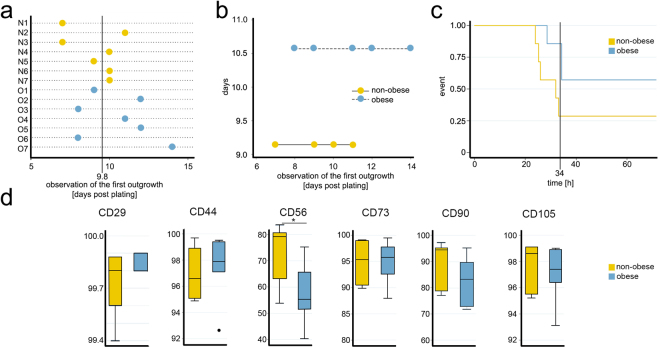
Significant differences between WJ MSCs isolated form non-obese and obese donors. (a) The WJ MSCs from the control groups showed an initial outgrowth on day 7 for donors N1 and N3 and on day 10 for donors N4, N6, and N7. Initial outgrowth for donors N5 and N2 was observed on days 9 and 11, respectively. In the cultures of explants from the obese group an initial outgrowth was evident on day 8 from donors O3 and O6 and on day 12 from donors O2 and O5. Donors O1 and O4 showed initial outgrowth on days 9 and 11, respectively. The explant culture from donor O7 was the slowest to establish and expand, showing the initial outgrowth on day 14. (b) Poisson model showed that the rate of initial outgrowth in the non-obese group (9.1 ± 1.5 days) was earlier than in the obese group (10.5 ± 2.2) but still not significant. The 95% confidence interval of the incidence rate ratio was 1.15 (0.827 to 1.61; p = 0.395). (c) The Kaplan-Meier curve using overall median of 34 h indicates that time to doubling of the WJ MSC from non-obese donors is superior. Stratified log-rank test for equality of functions has shown that the difference in the median time to doubling within the first 34 h is statistically significant (p = 0.048). (d) Expression profile of MSC surface markers. Mann-Whitney did not show significant difference between subpopulations of the two groups positive for CD29 (p = 0.268), CD44 (p = 0.482), CD73 (p = 0.949), CD90 (p = 0.249), and CD105 (p = 0.608), whereas CD56+ subpopulation was significantly smaller (p = 0.025) in the obese group (*p ≤ 0.05).

