Figure 2.
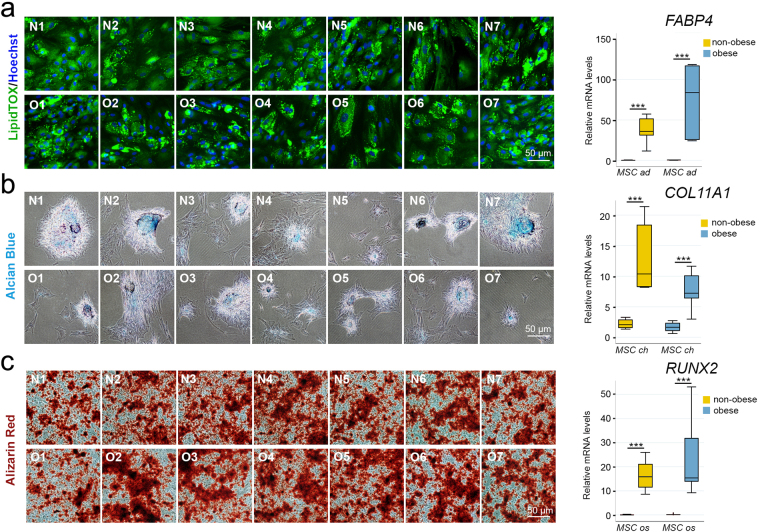
Propensity towards adipogenic, chondrogenic and osteogenic differentiation is similar between WJ MSCs from obese and non-obese donors. (a) Proadipogenic differentiation. Intracellular lipid droplets visualized with a fluorescent LipidTOX™ Green in WJ MSC from non-obese (N1–7) and obese donors (O1–7) following proadipogenic differentiation (left). Per Wilcoxon signed rank test, the expression level of adipogenic marker FABP4, as assessed by qPCR, was significantly higher in differentiated cells than in undifferentiated cells (***p ≤ 0.001) indicating adipogenesis (right). However, Mann-Whitney test did not find significant the overall differences between the obese and non-obese groups (p = 0.110). Analysis based on the Bootstrap model showed that the incidence rate ratio at the 95% confidence interval was −48.1 (−82.9 to 11.7). ad, cells undergoing proadipogenic differentiation; MSC, undifferentiated cells. (b) Prochondrogenic differentiation. Extracellular matrix rich in chondroitin sulfate glycosaminoglycans assessed with Alcian blue, pH 1.0 staining of WJ MSC from non-obese (N1–7) and obese (O1–7) donors following prochondrogenic differentiation (left). Per Wilcoxon signed rank test, the expression of chondrogenic marker COLL11A1, as assessed by qPCR, showed significant increase in WJ MSC from both non-obese and obese donors upon differentiation (***p ≤ 0.001), indicating chondrogenesis (right). However, Mann-Whitney test did not find significant differences between obese and non-obese groups (p = 0.063). Analysis based on the Bootstrap model showed that 95% confidence interval of the incidence rate ratio was 3.13 (−1.36 to 11.7). ch, cells undergoing prochondrogenic differentiation; MSC, undifferentiated cells. (c) Proosteogenic differentiation. Extracellular calcium deposits stained with Alizarin Red in WJ MSC from non-obese (N1–7) and obese (O1–7) donors following proosteogenic differentiation (left). Expression of osteogenic marker RUNX2 assessed by qPCR showed significant increase in WJ MSC from both non-obese and obese donors upon differentiation (***p ≤ 0.001) indicating osteogenesis (right). However, Mann-Whitney test did not find differences between the groups significant (p = 0.482). Analysis based on the Bootstrap model showed that the 95% confidence interval of the incidence rate ratio was 0.54 (−15.4 to 10.4). MSC, undifferentiated cells; os, cells undergoing proosteogenic differentiation.

