Figure 4.
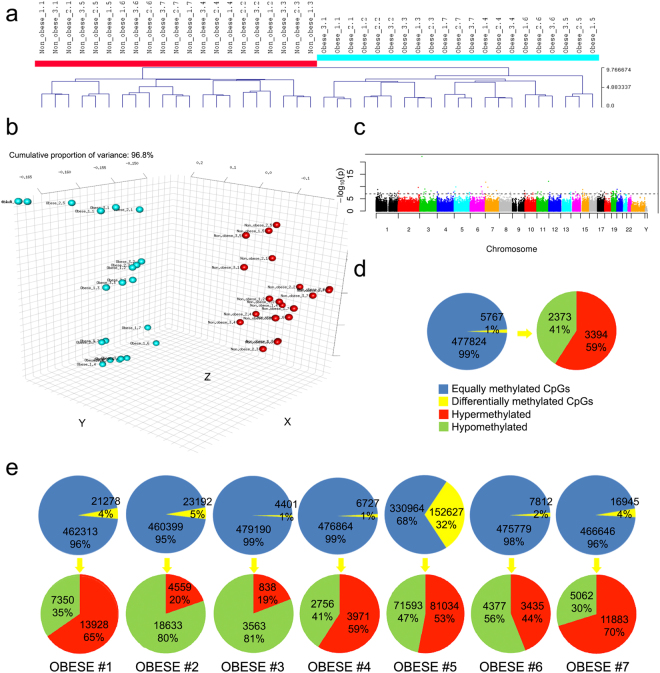
DNA methylation portrait. (a) Hierarchical clustering analysis based on epigenome-wide DNA methylation shows that the WJ MSC isolated from non-obese (n = 7) and obese donors (n = 7) cluster separately. WJ SMC from each donor were analysed in triplicates. (b) Principal component analysis (PCA) demonstrated that the WJ MSC from non-obese and obese donors formed separate clusters. (c) Manhattan plot indicates that altered methylation state was spread across all chromosomes. (d) Graphic showing percentage of differentially methylated CpG sites between averages of non-obese (n = 7) and obese (n = 7) samples. (e) Comparative analyses of WJ MSC from each obese donor vs. an average from all non-obese donors. Statistically significant alteration of methylation state was seen in 1–5% of all CpG sites in 6 out of 7 donors, whereas 32% of CpG sites were different in the samples from obese donor #5.

