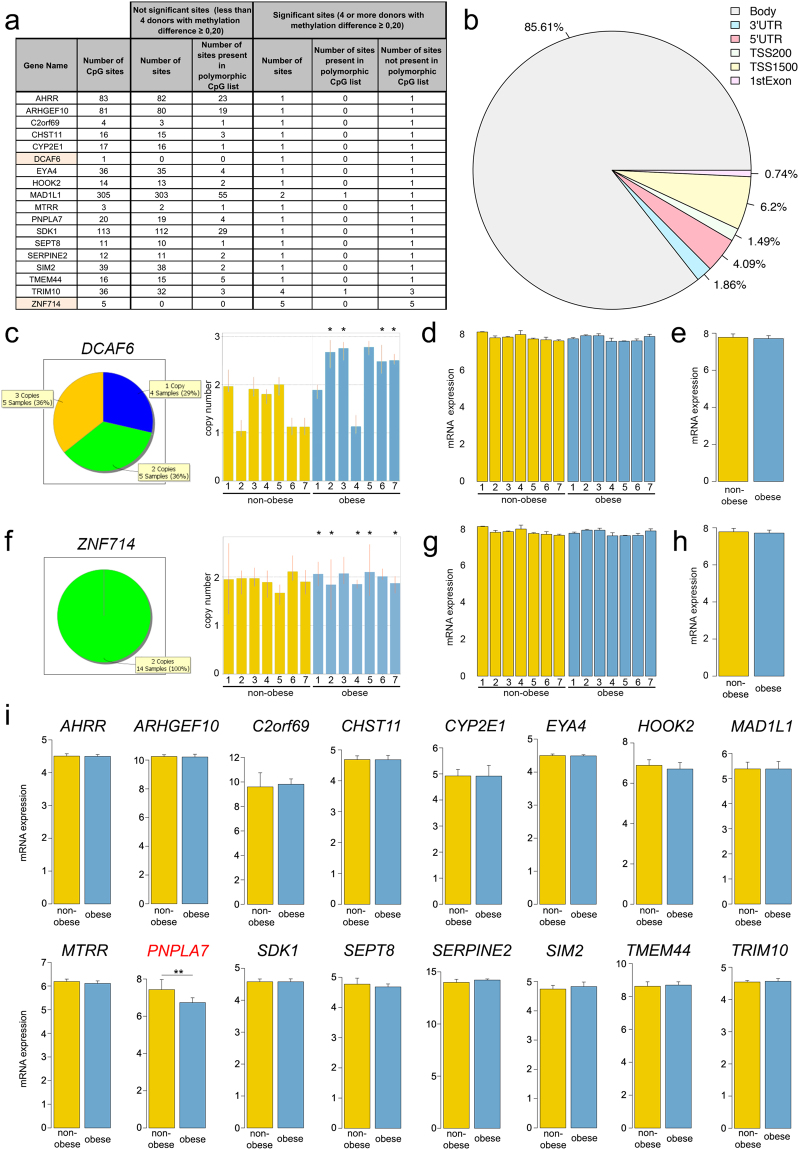
Figure 5.
Genes with significantly different DNA methylation in one or more CpG sites in non-polymorphic regions. (a) List of 18 genes that have one of more CpG sites in non-polymorphic regions with difference in methylation ≥20%. DCAF6 and ZNF714, highlighted orange, have variable copy number in genome. (b) Proportion of the locations of CpG sites in the 18 genes. TSS, transcription start site; TSS1500, the sequence region from −200 to −1,500 nucleotides upstream of the transcription start site; TSS200, the region from −200 nucleotides upstream to the TSS itself; UTR, untranslated region. (c) TaqMan Copy Number Assays for DCAF6 showed that among 14 donors, four have one copy of the gene (N2, N6, N7 and O4), five have two copies (N1, N3, N4, N5, and O1) and also five have three copies (O2, O3, O5, O6, and O7). All four WJ MSC samples that showed significantly different DCAF6 DNA methylation (*) originated from the donors that have three copies of the gene (O2, O3, O6, and O7). Each sample bar represents the mean calculated copy number and error bars show the standard deviation for three replicates. (d and e) Expression gene array did not detect significant difference DCAF6 mRNA expression in any of the samples indicating that duplicated DCAF6 genes might not be functional. (f) TaqMan Copy Number Assays for ZNF714 showed that all non-obese and obese donors have two copies of the ZNF714 gene. *Five donors that had significantly different DNA methylation of all CpG sites in ZNF714 (O1, O2, O4, O5, and O7). Each sample bar represents the mean calculated copy number and error bars show the standard deviation for three replicates. (g and h) Expression gene array did not detect significant difference ZNF714 mRNA expression in any of the samples indicating that the extra copy of ZNF714 gene might be either functional or not in all donors uniformly. (i) The mRNA expression levels of 16 genes showed no differences in the obese and non-obese groups. The Y axis represents the log2 of the normalized intensity values. The single exception was the PNPLA7 gene, which showed higher expression in the non-obese group than in the obese group (**p ≤ 0.01), the adjusted p-values from Linear Models for Microarray and RNA-Seq Data (limma) statistical test57,58.

