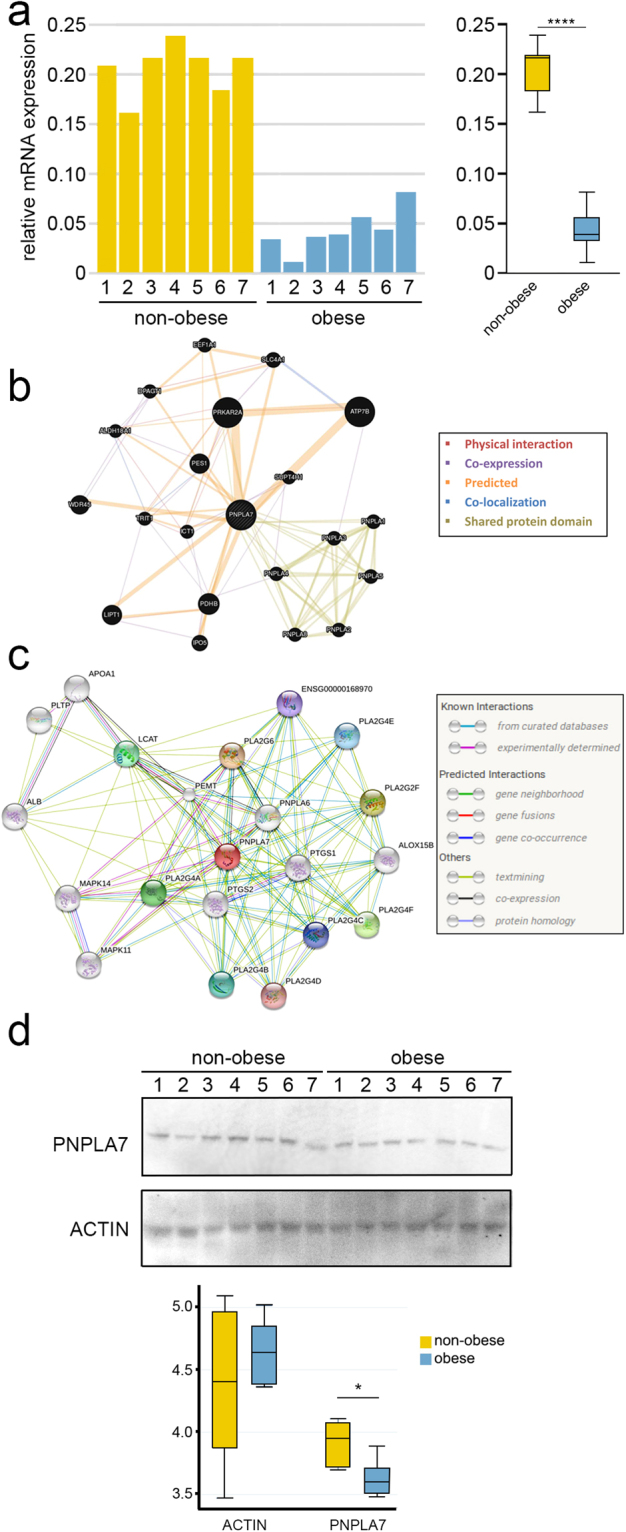
Figure 6.

PNPLA7 expression is lower in the WJ MSC from obese donors. (a) The transcriptome array data were validated using PNPLA7-specific qPCR. Mann-Whitney test showed that there is indeed a significant difference between the two groups (****p ≤ 0.0001). The mean ± SD of the gene expression level was 20.6 ± 2.55 in the non-obese group and 4.3 ± 2.16 in the obese group. Analysis based on the Bootstrap model showed that the 95% confidence interval of the incidence rate ratio was 0.18 (0.15 to 0.21). (b) The GeneMANIA Cytoscape plugin PNPLA7 gene function prediction using association approach. (c) Search Tool for the Retrieval of Interacting Genes/Proteins (STRING) predicted protein–protein interactions for PNPLA7. (d) Mann-Whitney test of the Western blot data indicates that the difference between the two groups is also maintained at the protein level (*p ≤ 0.01).
