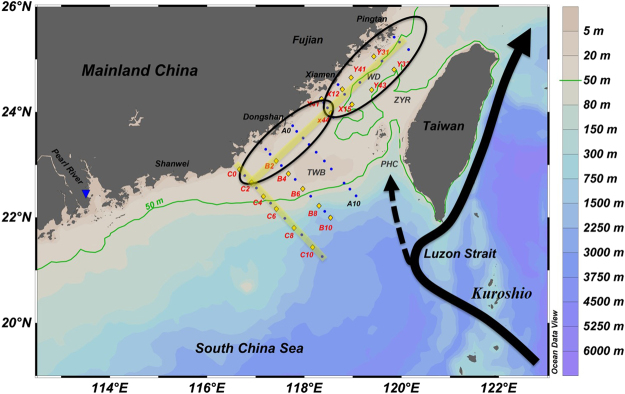
Figure 1.
Map of the Taiwan Strait showing the topography and the locations of the sampling stations. The yellow diamonds indicate stations where surface N2 fixation rates were assessed, the blue dots indicate those where parameters except N2 fixation rate were measured, and the blue triangle indicates the Pearl River outlet. Ellipses indicate the Dongshan Upwelling (DSU) and Pingtan Upwelling (PTU) regions. The black solid line is the Kuroshio Current, and the black dashed line is the Kuroshio branch. The light-yellow lines indicate the two sections demonstrated in Fig. 2. TWB (Taiwan Bank), PHC (Penghu Channel), ZYR (Zhangyun Ridge), and WD (Wuchou Depression). This figure was created using Ocean Data View (Schlitzer, R., Ocean Data View, http://odv.awi.de, 2017).

