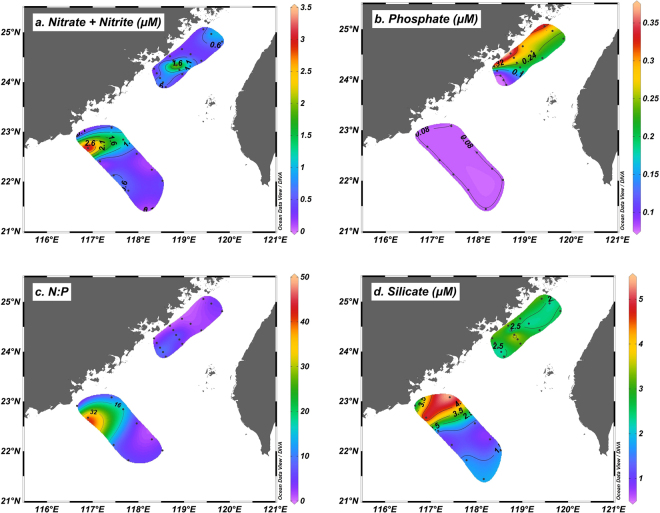
Figure 3.
Horizontal distributions of nutrients in the study region. Near-surface concentrations of (a) nitrate + nitrite (µM) and (b) phosphate (µM), and (c) calculated N:P ratios, and (d) near-surface concentration of silicate (µM). Note that PO4 3− concentrations at most stations in the SW area and the oligotrophic region were below the detection limit (0.08 μM). The actual N:P ratios at these stations should therefore be much higher than those calculated based on a PO4 3− concentration of 0.08 μM (Table S1). This figure was created using Ocean Data View (Schlitzer, R., Ocean Data View, http://odv.awi.de, 2017).

