
Fig 3. MiT/TFE transcription factors promote lysosomal recruitment of mTOR upon nutrient loading.
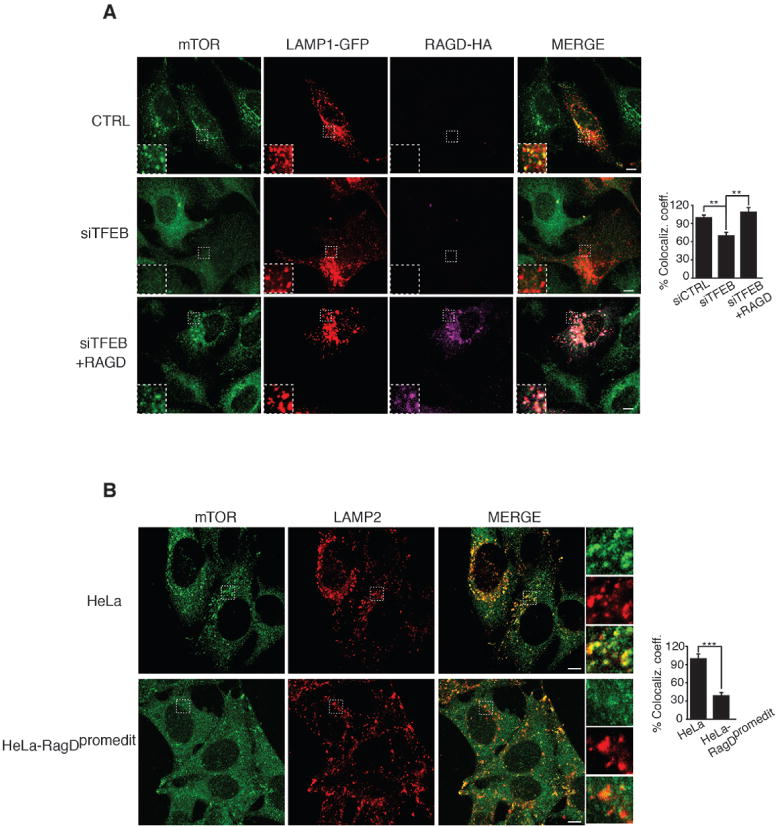
(A) Representative immunofluorescence images of endogenous mTOR, LAMP1-GFP (visualized as red) and RAGD-HA in HeLa cells. Cells were transfected with scramble (CTRL) or with TFEB siRNA (siTFEB) and after 48 hours with LAMP1-GFP and with RagD-HA plasmids for additional 24 hours. (B) Representative immunofluorescence images of mTOR and LAMP2 in HeLa-RagDpromedit and in control HeLa cells. (A,B) Cells were deprived of a.a. for 50 minutes and then stimulated with a.a. for 15 minutes. The plots represent quantification of the data from 15 cells per condition from three independent experiments. Results are shown as means of co-localization coefficient of mTOR and LAMP1± SEM (Anova, one-way) in (A) of mTOR and LAMP2 ± SEM (Student t test) in (B). (**p < 0.01, ***p < 0.001). Scale bars 10 μm.