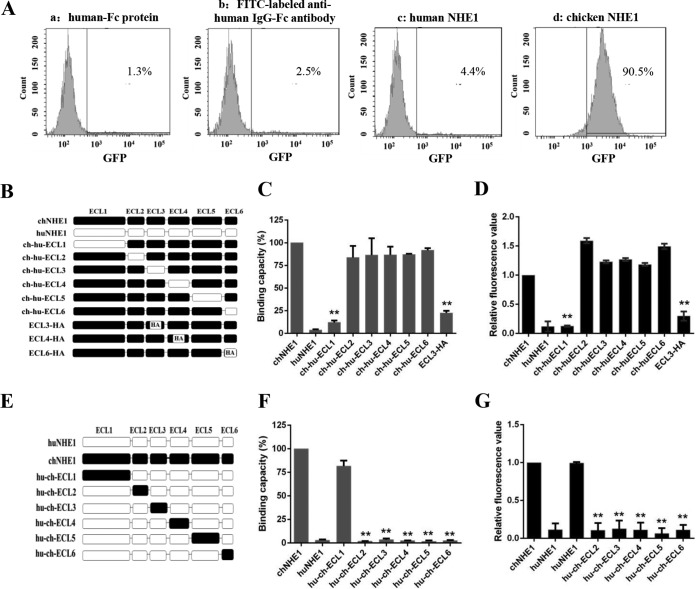
FIG 1.
ECL1 and ECL3 participate in the binding of chNHE1 and gp85 protein. (A) Validation of the receptor binding assay. The specific interaction of chNHE1 and gp85-Fc was evaluated using chNHE1-expressing 293T cells by fluorescence-activated cell sorting analysis (FACS). (a) chNHE1-expressing 293T cells incubated with human-Fc protein; (b) chNHE1-expressing 293T cells incubated with FITC-labeled anti-human Fc antibodies; (c) 293T cells expressing nonfunctional huNHE1 receptor incubated with gp85-Fc protein; (d) chNHE1-expressing 293T cells incubated with gp85-Fc protein. (B) Schematic representation of the strategy of constructing chimeric chNHE1 proteins with ECL1 to ECL6 replaced with the corresponding ECL domains of huNHE1 or hemagglutinin (HA) tag. Black, chNHE1 ECLs; white, huNHE1 ELCs; HA, HA tag. (C) The gp85-binding abilities of different chimeric chNHE1s expressed on the surface of transfected 293T cells, evaluated in a receptor binding assay. The binding capacity of wild-type chNHE1 was set to 100%, and the values for chimeric chNHE1 receptors were calculated as its proportion. (D) Entry of RCAS(J)-luciferase virus into 293T cells expressing different chimeric chNHE1s. Virus entry levels were determined using a luciferase reporter assay as described in Materials and Methods. The entry level of RCAS(J)-luciferase virus into 293T cells expressing wild-type chNHE1 was set to 1, and the values for chimeric chNHE1 receptors were calculated as its proportion. (E) Schematic representation of the strategy of constructing chimeric huNHE1s with ECL1 to ECL6 replaced with the corresponding ECLs of chNHE1. The color designations are as described for panel B. (F) The relative gp85-binding capacity of different chimeric huNHE1s expressed on the surface of transfected 293T cells. The binding ability was evaluated in a receptor binding assay. The binding capacity of wild-type chNHE1 was set as 100%, and the values for chimeric chNHE1 receptors were calculated as its proportion. (G) Entry of RCAS(J)-luciferase virus into 293T cells expressing different chimeric huNHE1s, as described for panel D. (B to D) Loss-of-function receptor analysis; (E to G) gain-of-function receptor analysis. (C, D, F, and G) Three independent experiments were performed, and data are shown as means ± standard deviations for triplicates from a representative experiment. **, P < 0.01.

