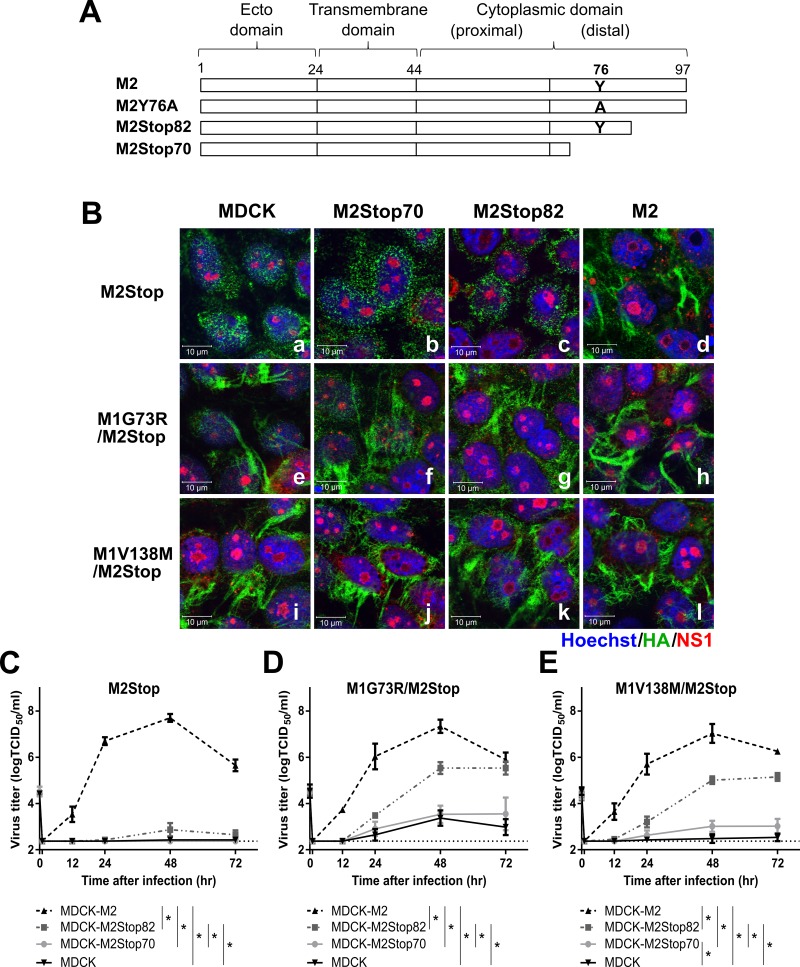
FIG 6.
The efficiency of M1 suppressor-mediated restoration of IAV infectivity is enhanced by the C-terminal region of the M2 cytoplasmic tail. The indicated viruses were used to infect MDCK, MDCK-M2Stop70, MDCK-M2Stop82, and MDCK-M2 cells. (A) Diagram of M2 truncations and M2Y76A. (B) Filamentous particle budding after a high-MOI infection was analyzed by immunofluorescence assay using an LSM 510 confocal microscope and a 100× objective. HA, NS1, and nucleus are shown in green, red, and blue, respectively. Representative images are shown. (C to E) Virus growth curves of rUd-M2Stop (C), rUd-M1G73R/M2Stop (D), and rUd-M1V138M/M2Stop (E) at an MOI of 0.01 were quantified using TCID50 assays. The dotted lines indicate the limits of detection. Statistically significant differences between cell lines are indicated by an asterisk (P < 0.01, two-way ANOVA with Bonferroni posttest). Data were analyzed from 2 to 3 independent experiments. Error bars are standard deviations.

