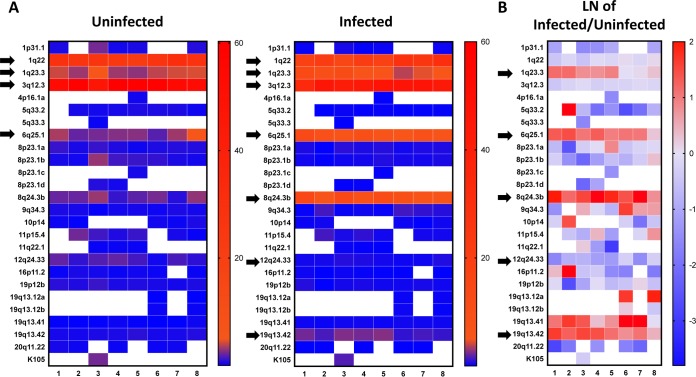
FIG 4.
(A) Heat map representation of HERV-K HML-2 expression in HIV-1-infected cells and uninfected controls from eight different donors. Elements contributing <0.2% of the total HERV-K HML-2 expression (in both samples of each infected/uninfected pair) are excluded. Arrows in the uninfected controls indicate elements with higher levels of expression, while in the infected samples, in addition to the higher expressers, the arrows also indicate the elements whose level of expression consistently changes upon infection. On the vertical side of the map are the chromosomal loci that specify the different HERV-K HML-2 proviruses (21); on the horizontal side of the map are the donors (1 to 8). (B) Heat map representing the change in HERV-K HML-2 expression upon HIV-1 infection. Values are provided as the natural logarithm (LN) of the ratio between the expression levels in infected and uninfected cells. Arrows indicate the elements whose expression level consistently changes upon infection. On the vertical side of the map are the chromosomal loci that specify the different HERV-K HML-2 proviruses (21); on the horizontal side of the map are the donors (1 to 8).

